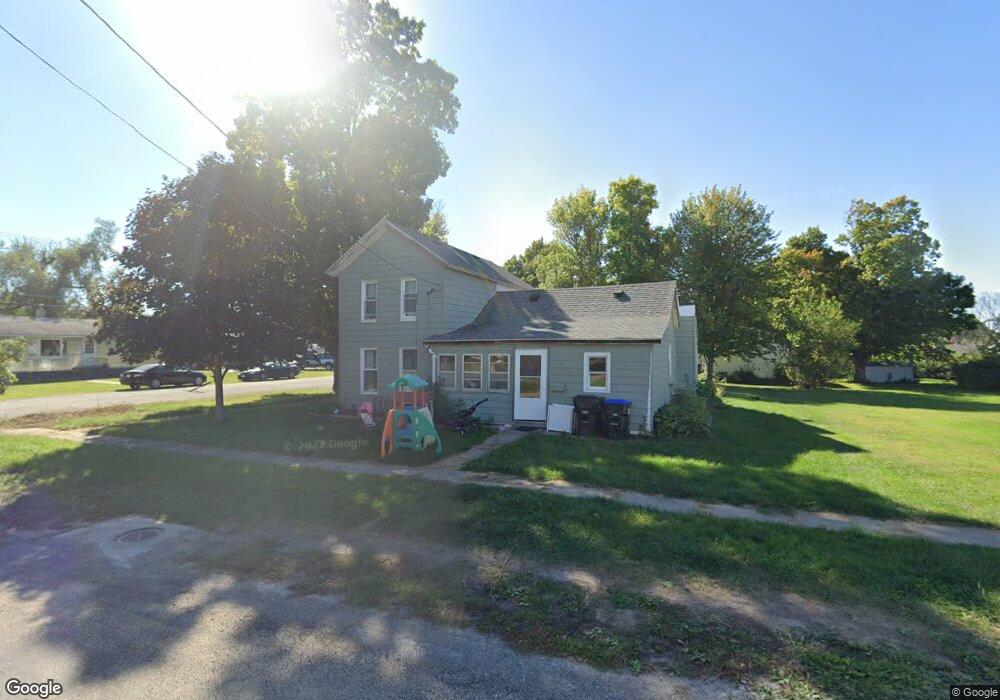
811 F Ave Vinton, IA 52349
Estimated Value: $91,000 - $132,000
3
Beds
1
Bath
1,348
Sq Ft
$78/Sq Ft
Est. Value
About This Home
This home is located at 811 F Ave, Vinton, IA 52349 and is currently estimated at $104,883, approximately $77 per square foot. 811 F Ave is a home located in Benton County with nearby schools including Tilford Elementary School, Shellsburg Elementary School, and Vinton-Shellsburg Middle School.
Ownership History
Date
Name
Owned For
Owner Type
Purchase Details
Closed on
Jun 7, 2016
Sold by
Curfman Emily J
Bought by
Curfman Danny D
Current Estimated Value
Purchase Details
Closed on
Sep 9, 2011
Sold by
Dart Curtiss P
Bought by
Curfman Danny D and Cripe Emily J
Home Financials for this Owner
Home Financials are based on the most recent Mortgage that was taken out on this home.
Original Mortgage
$54,000
Interest Rate
4%
Mortgage Type
Adjustable Rate Mortgage/ARM
Create a Home Valuation Report for This Property
The Home Valuation Report is an in-depth analysis detailing your home's value as well as a comparison with similar homes in the area
Home Values in the Area
Average Home Value in this Area
Purchase History
| Date | Buyer | Sale Price | Title Company |
|---|---|---|---|
| Curfman Danny D | -- | -- | |
| Curfman Danny D | $72,000 | None Available |
Source: Public Records
Mortgage History
| Date | Status | Borrower | Loan Amount |
|---|---|---|---|
| Previous Owner | Curfman Danny D | $54,000 |
Source: Public Records
Tax History Compared to Growth
Tax History
| Year | Tax Paid | Tax Assessment Tax Assessment Total Assessment is a certain percentage of the fair market value that is determined by local assessors to be the total taxable value of land and additions on the property. | Land | Improvement |
|---|---|---|---|---|
| 2025 | $1,340 | $89,300 | $15,500 | $73,800 |
| 2024 | $1,340 | $81,700 | $14,900 | $66,800 |
| 2023 | $1,304 | $81,700 | $14,900 | $66,800 |
| 2022 | $1,338 | $69,500 | $11,900 | $57,600 |
| 2021 | $1,338 | $69,500 | $11,900 | $57,600 |
| 2020 | $1,406 | $73,800 | $9,200 | $64,600 |
| 2019 | $1,336 | $73,800 | $9,200 | $64,600 |
| 2018 | $1,294 | $69,500 | $8,500 | $61,000 |
| 2017 | $1,236 | $69,500 | $8,500 | $61,000 |
| 2016 | $1,212 | $64,900 | $7,900 | $57,000 |
| 2015 | $1,212 | $64,900 | $7,900 | $57,000 |
| 2014 | $1,168 | $62,700 | $0 | $0 |
Source: Public Records
Map
Nearby Homes