811 Greendale Ave Needham, MA 02492
Estimated Value: $1,234,000 - $1,677,818
3
Beds
3
Baths
1,644
Sq Ft
$837/Sq Ft
Est. Value
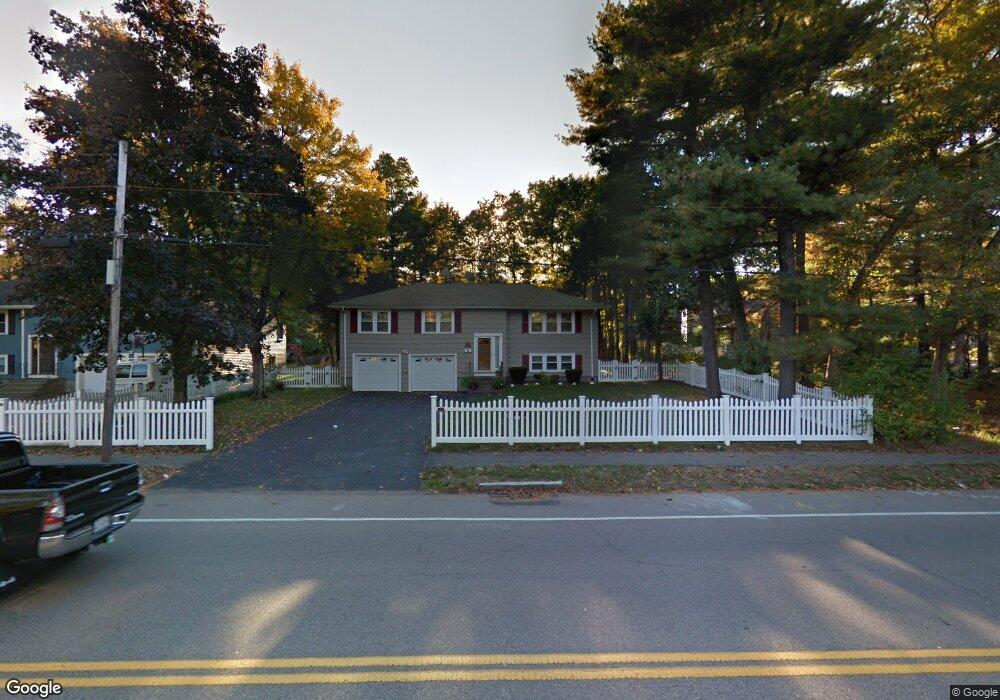
About This Home
This home is located at 811 Greendale Ave, Needham, MA 02492 and is currently estimated at $1,376,705, approximately $837 per square foot. 811 Greendale Ave is a home located in Norfolk County with nearby schools including Broadmeadow Elementary School, High Rock Middle School, and Pollard Middle School.
Ownership History
Date
Name
Owned For
Owner Type
Purchase Details
Closed on
Jun 5, 2024
Sold by
Kartsagoulis Haralambos D and Kartsagoulis Evanthia P
Bought by
Kartsagoulis Rt and Kartsagoulis
Current Estimated Value
Purchase Details
Closed on
Jun 8, 1998
Sold by
Demers Brian J
Bought by
Kartsagoulis Evanthia and Kartsagoulis H
Home Financials for this Owner
Home Financials are based on the most recent Mortgage that was taken out on this home.
Original Mortgage
$185,000
Interest Rate
7.05%
Mortgage Type
Purchase Money Mortgage
Purchase Details
Closed on
Aug 27, 1993
Sold by
Mctott William H and Mctott Agnes
Bought by
Demers Brian J
Home Financials for this Owner
Home Financials are based on the most recent Mortgage that was taken out on this home.
Original Mortgage
$173,600
Interest Rate
7.06%
Mortgage Type
Purchase Money Mortgage
Create a Home Valuation Report for This Property
The Home Valuation Report is an in-depth analysis detailing your home's value as well as a comparison with similar homes in the area
Home Values in the Area
Average Home Value in this Area
Purchase History
We collect this data history from publicly available records. To have your information removed, we recommend requesting removal directly through your county’s website.
| Date | Buyer | Sale Price | Title Company |
|---|---|---|---|
| Kartsagoulis Rt | -- | None Available | |
| Kartsagoulis Rt | -- | None Available | |
| Kartsagoulis Evanthia | $285,000 | -- | |
| Demers Brian J | $225,000 | -- | |
| Kartsagoulis Evanthia | $285,000 | -- | |
| Demers Brian J | $225,000 | -- |
Source: Public Records
Mortgage History
We collect this data history from publicly available records. To have your information removed, we recommend requesting removal directly through your county’s website.
| Date | Status | Borrower | Loan Amount |
|---|---|---|---|
| Previous Owner | Demers Brian J | $185,000 | |
| Previous Owner | Demers Brian J | $25,000 | |
| Previous Owner | Demers Brian J | $173,600 |
Source: Public Records
Tax History
| Year | Tax Paid | Tax Assessment Tax Assessment Total Assessment is a certain percentage of the fair market value that is determined by local assessors to be the total taxable value of land and additions on the property. | Land | Improvement |
|---|---|---|---|---|
| 2025 | $11,324 | $1,068,300 | $723,300 | $345,000 |
| 2024 | $10,559 | $843,400 | $503,100 | $340,300 |
| 2023 | $10,629 | $815,100 | $503,100 | $312,000 |
| 2022 | $10,011 | $748,800 | $445,500 | $303,300 |
| 2021 | $9,757 | $748,800 | $445,500 | $303,300 |
| 2020 | $9,540 | $763,800 | $445,500 | $318,300 |
| 2019 | $8,920 | $719,900 | $405,200 | $314,700 |
| 2018 | $8,552 | $719,900 | $405,200 | $314,700 |
| 2017 | $8,089 | $680,300 | $405,200 | $275,100 |
| 2016 | $7,884 | $683,200 | $405,200 | $278,000 |
| 2015 | $7,713 | $683,200 | $405,200 | $278,000 |
| 2014 | $7,095 | $609,500 | $338,000 | $271,500 |
Source: Public Records
Map
Nearby Homes
- 883 Greendale Ave
- 60 Tudor Rd
- 969 Greendale Ave Unit 969
- 969 Greendale Ave
- 173 Fairfield St
- 22 Edwardel Rd
- 28 Green St
- 52 Longacre Rd
- 52 Beaufort Ave
- 1202 Greendale Ave Unit 133
- 1202 Greendale Ave Unit 124
- 1210 Greendale Ave Unit 338
- 1210 Greendale Ave Unit 340
- 9 Morley St
- 67 Van Roosen Rd
- 10 Spiers Rd
- 36 Upland Rd
- 18 Avon Cir
- 11 Mayo Ave
- 23 Cheney St
- 817 Greendale Ave
- 4 Broad Meadow Rd
- 0 Broad Meadow Rd
- 12 Broad Meadow Rd
- 829 Greendale Ave
- 11 Kenney St
- 11 Cogswell Ct
- 810 Greendale Ave
- 5 Cogswell Ct
- 19 Kenney St
- 21 Kenney St
- 7 Broad Meadow Rd
- 25 Kenney St
- 818 Greendale Ave
- 800 Greendale Ave
- 14 Cogswell Ct
- 8 Old Greendale Ave
- 6 Kenney St
- 787 Greendale Ave
- 31 Kenney St
Your Personal Tour Guide
Ask me questions while you tour the home.