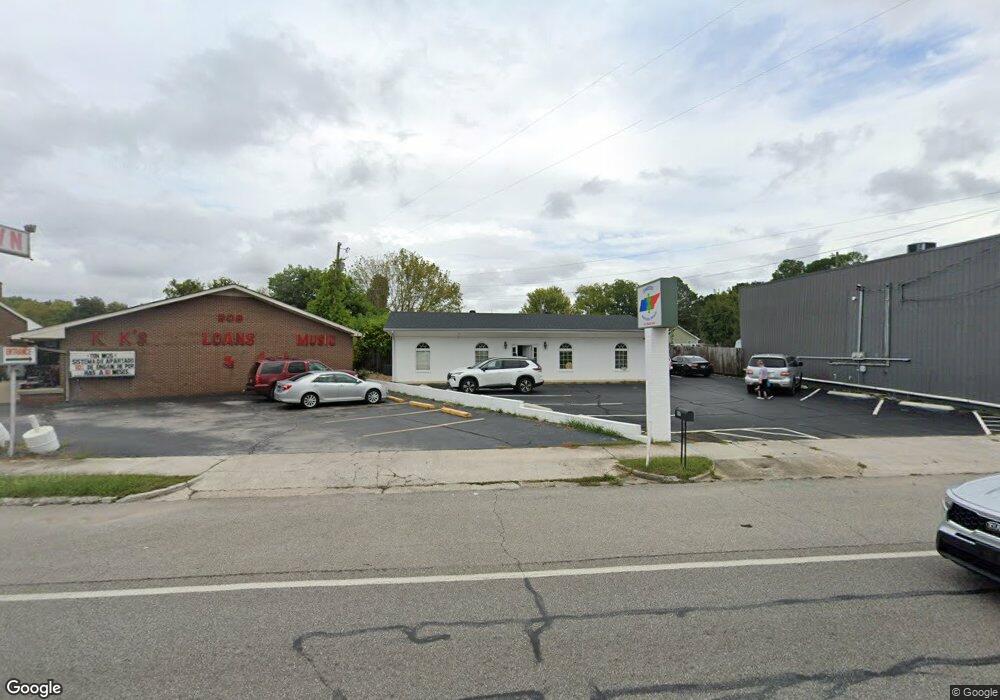
811 Hillsboro Blvd Manchester, TN 37355
Estimated Value: $202,123
--
Bed
1
Bath
1,440
Sq Ft
$140/Sq Ft
Est. Value
About This Home
This home is located at 811 Hillsboro Blvd, Manchester, TN 37355 and is currently estimated at $202,123, approximately $140 per square foot. 811 Hillsboro Blvd is a home located in Coffee County with nearby schools including Westwood Middle School and Temple Baptist Christian School.
Ownership History
Date
Name
Owned For
Owner Type
Purchase Details
Closed on
Aug 30, 2022
Sold by
Jackson Jeffrey L and Jackson Tiffiney K
Bought by
Neel Jonathon Eric and Neel Katie Ann
Current Estimated Value
Purchase Details
Closed on
Nov 12, 2004
Sold by
Brown Johnnie Jane Heard
Bought by
Jackson Jeffrey L
Home Financials for this Owner
Home Financials are based on the most recent Mortgage that was taken out on this home.
Original Mortgage
$96,500
Interest Rate
5.66%
Mortgage Type
Commercial
Create a Home Valuation Report for This Property
The Home Valuation Report is an in-depth analysis detailing your home's value as well as a comparison with similar homes in the area
Home Values in the Area
Average Home Value in this Area
Purchase History
| Date | Buyer | Sale Price | Title Company |
|---|---|---|---|
| Neel Jonathon Eric | $182,000 | Shawn C Trail Pc | |
| Jackson Jeffrey L | $96,500 | -- |
Source: Public Records
Mortgage History
| Date | Status | Borrower | Loan Amount |
|---|---|---|---|
| Previous Owner | Jackson Jeffrey L | $96,500 |
Source: Public Records
Tax History Compared to Growth
Tax History
| Year | Tax Paid | Tax Assessment Tax Assessment Total Assessment is a certain percentage of the fair market value that is determined by local assessors to be the total taxable value of land and additions on the property. | Land | Improvement |
|---|---|---|---|---|
| 2024 | $2,148 | $50,960 | $12,720 | $38,240 |
| 2023 | $2,148 | $50,960 | $0 | $0 |
| 2022 | $1,850 | $50,960 | $12,720 | $38,240 |
| 2021 | $2,186 | $47,720 | $10,880 | $36,840 |
| 2020 | $2,186 | $47,720 | $10,880 | $36,840 |
| 2019 | $2,186 | $47,720 | $10,880 | $36,840 |
| 2018 | $2,186 | $47,720 | $10,880 | $36,840 |
| 2017 | $2,302 | $43,880 | $8,000 | $35,880 |
| 2016 | $2,302 | $43,880 | $8,000 | $35,880 |
| 2015 | $2,302 | $43,880 | $8,000 | $35,880 |
| 2014 | $2,302 | $43,891 | $0 | $0 |
Source: Public Records
Map
Nearby Homes