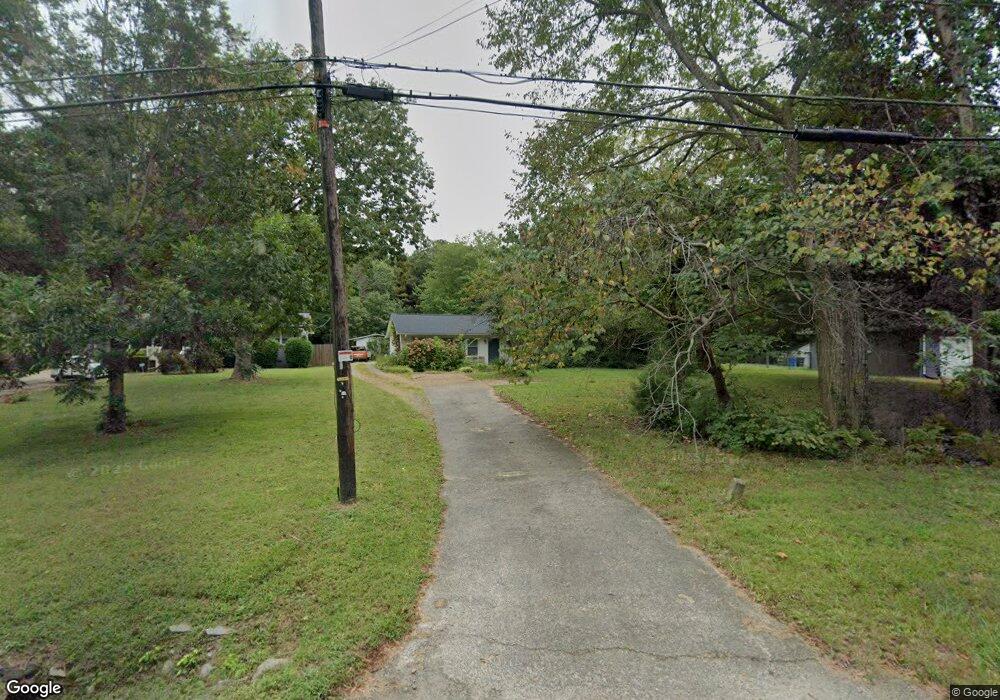
811 Lynn Rd Durham, NC 27703
Eastern Durham NeighborhoodEstimated Value: $279,000 - $331,000
3
Beds
2
Baths
1,456
Sq Ft
$213/Sq Ft
Est. Value
About This Home
This home is located at 811 Lynn Rd, Durham, NC 27703 and is currently estimated at $309,945, approximately $212 per square foot. 811 Lynn Rd is a home located in Durham County with nearby schools including Bethesda Elementary School, John W Neal Middle School, and Southern School of Energy & Sustainability.
Ownership History
Date
Name
Owned For
Owner Type
Purchase Details
Closed on
Oct 18, 2018
Sold by
Lippard Stephen E and Lippard Barbara C
Bought by
Williams Candice M
Current Estimated Value
Home Financials for this Owner
Home Financials are based on the most recent Mortgage that was taken out on this home.
Original Mortgage
$168,780
Outstanding Balance
$147,186
Interest Rate
4.5%
Mortgage Type
New Conventional
Estimated Equity
$162,759
Purchase Details
Closed on
Feb 27, 2008
Sold by
Martin Rodney R and Martin Jennifer L
Bought by
Lippard Stephen E and Lippard Barbara C
Home Financials for this Owner
Home Financials are based on the most recent Mortgage that was taken out on this home.
Original Mortgage
$129,200
Interest Rate
5.65%
Mortgage Type
Purchase Money Mortgage
Purchase Details
Closed on
Apr 2, 1998
Sold by
Ann Rocco Christine and Ann Mark A
Bought by
Martin Rodney R and Lowery Jennifer D
Home Financials for this Owner
Home Financials are based on the most recent Mortgage that was taken out on this home.
Original Mortgage
$94,050
Interest Rate
6.95%
Create a Home Valuation Report for This Property
The Home Valuation Report is an in-depth analysis detailing your home's value as well as a comparison with similar homes in the area
Home Values in the Area
Average Home Value in this Area
Purchase History
| Date | Buyer | Sale Price | Title Company |
|---|---|---|---|
| Williams Candice M | $174,000 | None Available | |
| Lippard Stephen E | $136,000 | None Available | |
| Martin Rodney R | $99,000 | -- |
Source: Public Records
Mortgage History
| Date | Status | Borrower | Loan Amount |
|---|---|---|---|
| Open | Williams Candice M | $168,780 | |
| Previous Owner | Lippard Stephen E | $129,200 | |
| Previous Owner | Martin Rodney R | $94,050 |
Source: Public Records
Tax History
| Year | Tax Paid | Tax Assessment Tax Assessment Total Assessment is a certain percentage of the fair market value that is determined by local assessors to be the total taxable value of land and additions on the property. | Land | Improvement |
|---|---|---|---|---|
| 2025 | $2,888 | $291,352 | $114,750 | $176,602 |
| 2024 | $2,157 | $154,606 | $30,520 | $124,086 |
| 2023 | $2,025 | $154,606 | $30,520 | $124,086 |
| 2022 | $1,979 | $154,606 | $30,520 | $124,086 |
| 2021 | $1,970 | $154,606 | $30,520 | $124,086 |
| 2020 | $1,923 | $154,606 | $30,520 | $124,086 |
| 2019 | $1,923 | $154,606 | $30,520 | $124,086 |
| 2018 | $1,542 | $113,706 | $30,520 | $83,186 |
| 2017 | $1,531 | $113,706 | $30,520 | $83,186 |
| 2016 | $1,479 | $113,706 | $30,520 | $83,186 |
| 2015 | $1,753 | $126,651 | $21,912 | $104,739 |
| 2014 | $1,753 | $126,651 | $21,912 | $104,739 |
Source: Public Records
Map
Nearby Homes
- 818 Lynn Rd
- 806 Lindley Dr
- 3111 Ivey Wood Ln
- 3211 Ivey Wood Ln
- 1218 Kendall Dr
- 305 Kendall Dr Unit 203
- 1316 Kendall Dr
- 428 Walton St
- 426 Walton St
- 404 Lynn Rd
- 509 Walton St
- 519 Pleasant Dr
- 202 Lynn Rd
- 102 Harvest Oaks Ln Unit 38
- 2055 Tanners Mill Dr
- 1015 Sora Way
- 1030 Thoughtful Spot Ln
- 706 Carter Ave
- 709 Carter Ave
- 3563 Carr Rd
- 809 Lynn Rd
- 817 Lynn Rd
- 803 Lynn Rd
- 3210 Nantuckett Ave
- 3210 Nantucket Ave
- 804 Lynn Rd
- 812 Lynn Rd
- 814 Lynn Rd
- 3123 Gibson Rd
- 3125 Gibson Rd
- 3214 Nantuckett Ave
- 3214 Nantucket Ave
- 902 Stennis Way
- 822 Lynn Rd
- 3207 Nantuckett Ave
- 723 Lynn Rd
- 8 Kitty Hawk Ct
- 6 Kitty Hawk Ct
- 10 Kitty Hawk Ct
- 904 Stennis Way
Your Personal Tour Guide
Ask me questions while you tour the home.