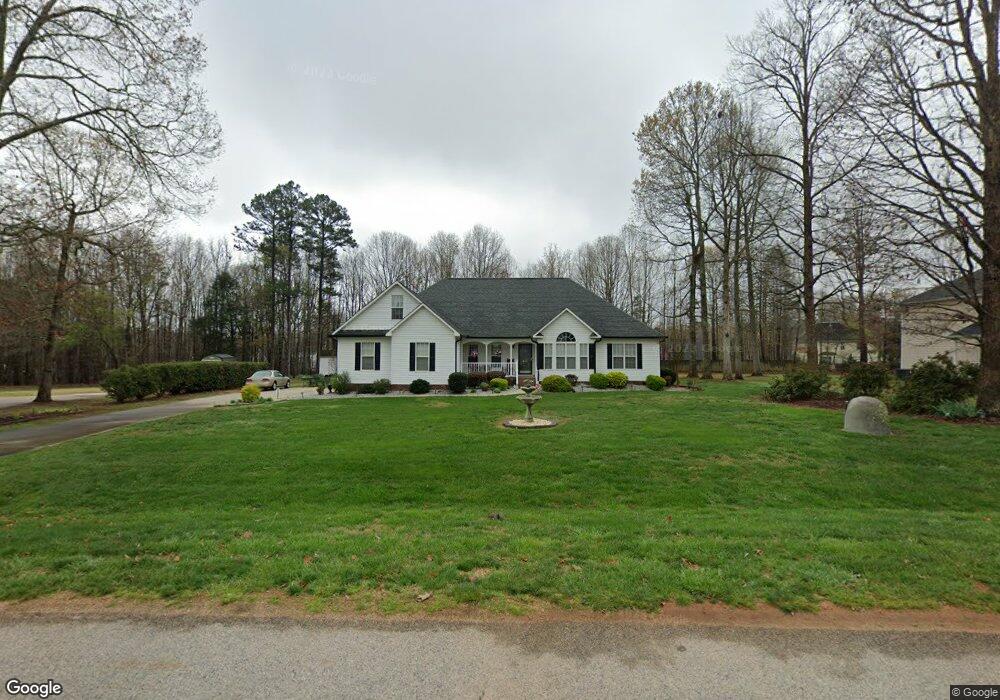
811 Maple Ridge Cir Salisbury, NC 28147
Estimated Value: $434,613 - $535,000
4
Beds
3
Baths
2,490
Sq Ft
$190/Sq Ft
Est. Value
About This Home
This home is located at 811 Maple Ridge Cir, Salisbury, NC 28147 and is currently estimated at $473,653, approximately $190 per square foot. 811 Maple Ridge Cir is a home located in Rowan County with nearby schools including Knollwood Elementary School, Southeast Middle School, and Jesse C Carson High School.
Ownership History
Date
Name
Owned For
Owner Type
Purchase Details
Closed on
Feb 14, 2020
Sold by
Holland Alonzo H and Holland Chalese
Bought by
Holland Carolyn Long and Holland Edgrick L
Current Estimated Value
Purchase Details
Closed on
Feb 15, 2019
Sold by
Holland Carolyn L
Bought by
Holland Alonzo H and Holland Edgrick L
Purchase Details
Closed on
Apr 14, 2014
Sold by
Holland Carolyn L and Napoleon Carolyn Holland
Bought by
Holland Carolyn L
Purchase Details
Closed on
Feb 27, 2012
Sold by
Napoleon George W
Bought by
Holland Carolyn L and Napoleon George W
Home Financials for this Owner
Home Financials are based on the most recent Mortgage that was taken out on this home.
Original Mortgage
$198,681
Outstanding Balance
$136,740
Interest Rate
3.91%
Mortgage Type
VA
Estimated Equity
$336,913
Create a Home Valuation Report for This Property
The Home Valuation Report is an in-depth analysis detailing your home's value as well as a comparison with similar homes in the area
Purchase History
| Date | Buyer | Sale Price | Title Company |
|---|---|---|---|
| Holland Carolyn Long | -- | None Available | |
| Holland Alonzo H | -- | None Available | |
| Holland Carolyn L | -- | None Available | |
| Holland Carolyn L | -- | None Available | |
| Napoleon George W | $194,500 | None Available |
Source: Public Records
Mortgage History
| Date | Status | Borrower | Loan Amount |
|---|---|---|---|
| Open | Napoleon George W | $198,681 |
Source: Public Records
Tax History
| Year | Tax Paid | Tax Assessment Tax Assessment Total Assessment is a certain percentage of the fair market value that is determined by local assessors to be the total taxable value of land and additions on the property. | Land | Improvement |
|---|---|---|---|---|
| 2025 | $2,499 | $368,836 | $37,500 | $331,336 |
| 2024 | $2,499 | $368,836 | $37,500 | $331,336 |
| 2023 | $2,499 | $368,836 | $37,500 | $331,336 |
| 2022 | $1,783 | $236,123 | $32,000 | $204,123 |
| 2021 | $1,765 | $236,123 | $32,000 | $204,123 |
| 2020 | $1,765 | $236,123 | $32,000 | $204,123 |
| 2019 | $1,765 | $236,123 | $32,000 | $204,123 |
| 2018 | $1,344 | $181,384 | $28,500 | $152,884 |
| 2017 | $1,344 | $181,384 | $28,500 | $152,884 |
| 2016 | $1,344 | $181,384 | $28,500 | $152,884 |
| 2015 | $1,360 | $181,384 | $28,500 | $152,884 |
| 2014 | $1,301 | $181,912 | $28,500 | $153,412 |
Source: Public Records
Map
Nearby Homes
- 143 Maple Ridge Cir
- 462 Cress Loop Rd
- 132 Chelton Ct
- 688 Cress School Rd
- 130 Lois Ln
- 2740 Hill Top Dr
- 397 Bramblewood Dr Unit 50
- 328 Bramblewood Dr
- 895 Cooper Rd
- 4115 Miller Rd
- 1348 Greenheather Dr
- 6255 Meadow Ln
- 215 Autumn Chapel Dr
- 1910 Cooper Rd
- 735 Grace Church Rd
- 491 Cornwall Dr
- 0 Patrick Dr
- 228 Hollybrook Ct
- 5650 Bertie Ave
- 355 Swink Ave
- 773 Maple Ridge Cir
- 833 Maple Ridge Cir
- 467 Maple Ridge Cir
- 445 Maple Ridge Cir
- 751 Maple Ridge Cir
- 489 Maple Ridge Cir Unit 262
- 1015 Jasmine Cir
- 423 Maple Ridge Cir
- 511 Maple Ridge Cir
- 748 Maple Ridge Cir
- 337 Maple Ridge Cir
- 729 Maple Ridge Cir
- 383 Maple Ridge Cir
- 299 Maple Ridge Cir
- 1041 Jasmine Cir
- 533 Maple Ridge Cir
- 1042 Jasmine Cir
- 476 Maple Ridge Cir
- 454 Maple Ridge Cir
- 697 Maple Ridge Cir Unit 256
Your Personal Tour Guide
Ask me questions while you tour the home.