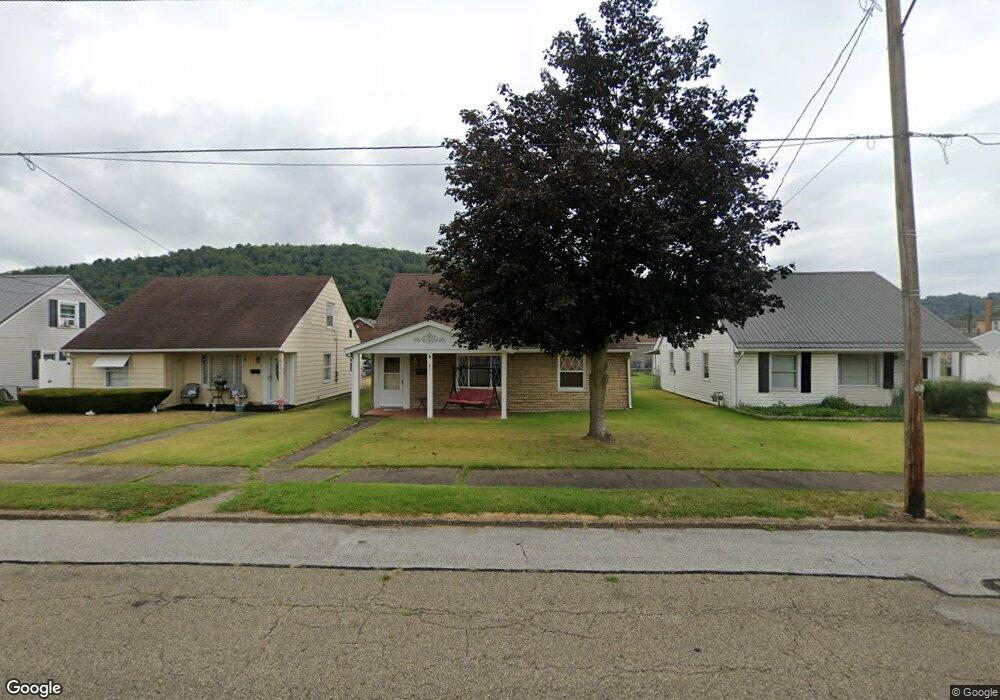
811 N 3rd St Toronto, OH 43964
Estimated Value: $101,000 - $115,000
3
Beds
1
Bath
1,278
Sq Ft
$85/Sq Ft
Est. Value
About This Home
This home is located at 811 N 3rd St, Toronto, OH 43964 and is currently estimated at $108,642, approximately $85 per square foot. 811 N 3rd St is a home located in Jefferson County with nearby schools including Toronto Jr./Sr. High School and St. Francis Central School.
Ownership History
Date
Name
Owned For
Owner Type
Purchase Details
Closed on
Oct 19, 2010
Sold by
Sutton Christina D
Bought by
Baier Cynthia M
Current Estimated Value
Home Financials for this Owner
Home Financials are based on the most recent Mortgage that was taken out on this home.
Original Mortgage
$56,000
Outstanding Balance
$36,992
Interest Rate
4.37%
Estimated Equity
$71,650
Purchase Details
Closed on
Sep 10, 2008
Sold by
Clelland Judy M
Bought by
Sutton Christina D
Home Financials for this Owner
Home Financials are based on the most recent Mortgage that was taken out on this home.
Original Mortgage
$73,561
Interest Rate
6.57%
Create a Home Valuation Report for This Property
The Home Valuation Report is an in-depth analysis detailing your home's value as well as a comparison with similar homes in the area
Home Values in the Area
Average Home Value in this Area
Purchase History
| Date | Buyer | Sale Price | Title Company |
|---|---|---|---|
| Baier Cynthia M | -- | -- | |
| Sutton Christina D | -- | -- |
Source: Public Records
Mortgage History
| Date | Status | Borrower | Loan Amount |
|---|---|---|---|
| Open | Baier Cynthia M | $56,000 | |
| Previous Owner | Sutton Christina D | $73,561 |
Source: Public Records
Tax History Compared to Growth
Tax History
| Year | Tax Paid | Tax Assessment Tax Assessment Total Assessment is a certain percentage of the fair market value that is determined by local assessors to be the total taxable value of land and additions on the property. | Land | Improvement |
|---|---|---|---|---|
| 2024 | $1,094 | $31,227 | $2,968 | $28,259 |
| 2023 | $1,094 | $23,289 | $2,499 | $20,790 |
| 2022 | $875 | $23,289 | $2,499 | $20,790 |
| 2021 | $875 | $23,289 | $2,499 | $20,790 |
| 2020 | $858 | $22,313 | $2,205 | $20,108 |
| 2019 | $861 | $0 | $0 | $0 |
| 2018 | $855 | $0 | $0 | $0 |
| 2017 | $1,001 | $0 | $0 | $0 |
| 2016 | $1,018 | $0 | $0 | $0 |
| 2015 | $1,008 | $0 | $0 | $0 |
| 2014 | $970 | $0 | $0 | $0 |
| 2012 | $476 | $23,450 | $3,045 | $20,405 |
Source: Public Records
Map
Nearby Homes