Estimated Value: $200,000 - $208,000
3
Beds
2
Baths
1,491
Sq Ft
$137/Sq Ft
Est. Value
About This Home
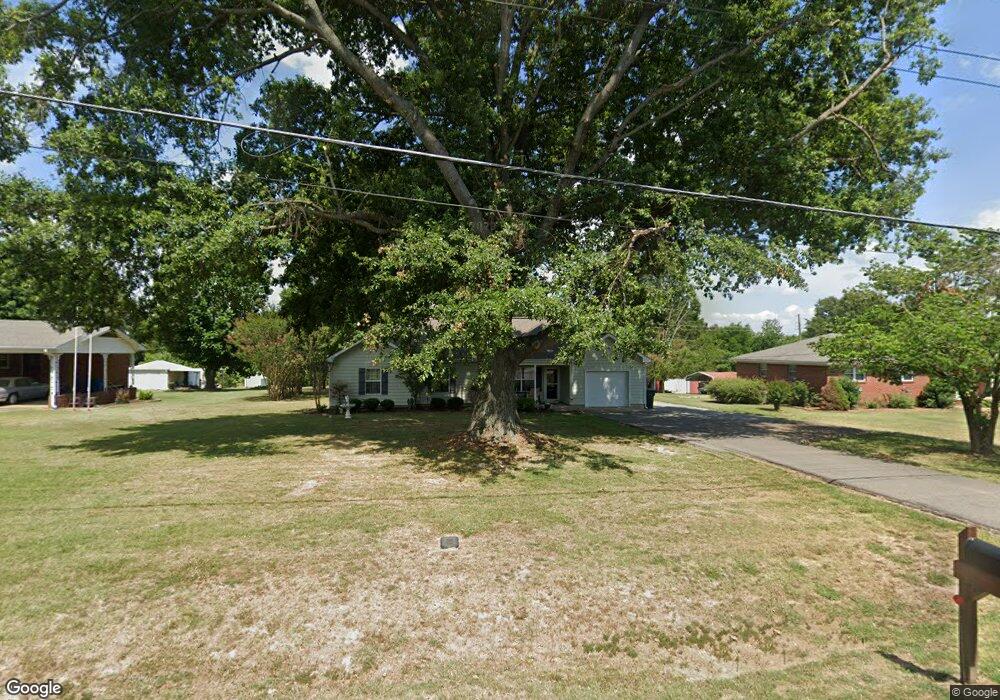
This home is located at 811 N Main St, Dyer, TN 38330 and is currently estimated at $204,252, approximately $136 per square foot. 811 N Main St is a home located in Gibson County with nearby schools including Dyer Elementary School and Gibson County High School.
Ownership History
Date
Name
Owned For
Owner Type
Purchase Details
Closed on
Dec 17, 2013
Sold by
Mikkelsen Thomas A
Bought by
Pierce Danny R and Pierce Delilah A
Current Estimated Value
Home Financials for this Owner
Home Financials are based on the most recent Mortgage that was taken out on this home.
Original Mortgage
$97,886
Outstanding Balance
$73,278
Interest Rate
4.25%
Mortgage Type
New Conventional
Estimated Equity
$130,974
Purchase Details
Closed on
Apr 14, 2007
Sold by
Watson Joe E
Bought by
Mikkelsen Cindy
Purchase Details
Closed on
Jul 29, 2005
Sold by
Morgan Louise K
Bought by
Watson Amylia L
Home Financials for this Owner
Home Financials are based on the most recent Mortgage that was taken out on this home.
Original Mortgage
$57,600
Interest Rate
5.48%
Purchase Details
Closed on
May 4, 1987
Bought by
Morgan Alvin M and Morgan Louise K
Purchase Details
Closed on
Jan 2, 1900
Create a Home Valuation Report for This Property
The Home Valuation Report is an in-depth analysis detailing your home's value as well as a comparison with similar homes in the area
Home Values in the Area
Average Home Value in this Area
Purchase History
| Date | Buyer | Sale Price | Title Company |
|---|---|---|---|
| Pierce Danny R | $109,000 | -- | |
| Mikkelsen Cindy | $6,000 | -- | |
| Watson Amylia L | $72,000 | -- | |
| Morgan Alvin M | -- | -- | |
| -- | -- | -- |
Source: Public Records
Mortgage History
| Date | Status | Borrower | Loan Amount |
|---|---|---|---|
| Open | Pierce Danny R | $97,886 | |
| Previous Owner | Not Available | $57,600 |
Source: Public Records
Tax History Compared to Growth
Tax History
| Year | Tax Paid | Tax Assessment Tax Assessment Total Assessment is a certain percentage of the fair market value that is determined by local assessors to be the total taxable value of land and additions on the property. | Land | Improvement |
|---|---|---|---|---|
| 2024 | $1,731 | $49,950 | $3,500 | $46,450 |
| 2023 | $971 | $31,175 | $2,025 | $29,150 |
| 2022 | $949 | $31,175 | $2,025 | $29,150 |
| 2021 | $949 | $31,175 | $2,025 | $29,150 |
| 2020 | $1,551 | $31,175 | $2,025 | $29,150 |
| 2019 | $1,436 | $31,175 | $2,025 | $29,150 |
| 2018 | $1,458 | $28,875 | $2,025 | $26,850 |
| 2017 | $1,400 | $28,875 | $2,025 | $26,850 |
| 2016 | $1,400 | $28,875 | $2,025 | $26,850 |
| 2015 | $1,275 | $28,875 | $2,025 | $26,850 |
| 2014 | $1,244 | $28,150 | $2,025 | $26,125 |
Source: Public Records
Map
Nearby Homes
- 173 Orr Rd
- 117 Washington St
- 0 Royal St
- 208 & 210 Lee St
- 205 Division St
- 288 W Broad St
- 23 Gravettes Crossing Rd W
- 142 S Poplar St
- 139 Peach St
- 354 E Maple St
- 299 E Walnut St
- 217 Central St
- 163 Monroe St
- 137 W South St
- 153 New Hope St
- 548 E College St
- 246 Thomas St
- 901 S Trenton St
- 0 Reed Rd
- 148 Scattered Acres Loop