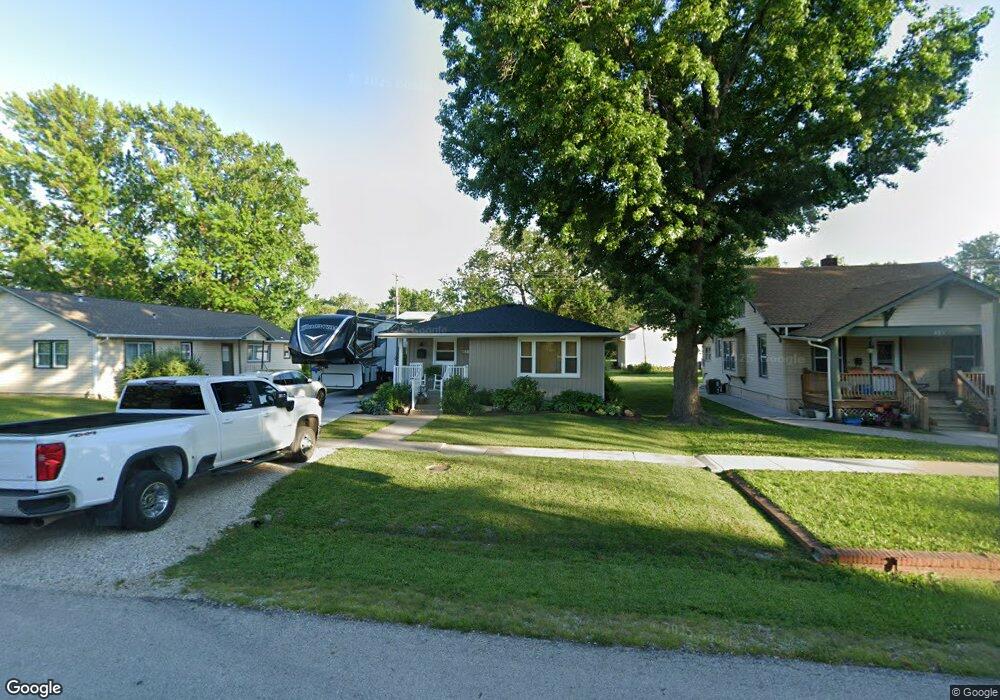
811 Niagara St Burlington, KS 66839
Estimated Value: $133,000 - $149,000
2
Beds
1
Bath
856
Sq Ft
$163/Sq Ft
Est. Value
About This Home
This home is located at 811 Niagara St, Burlington, KS 66839 and is currently estimated at $139,547, approximately $163 per square foot. 811 Niagara St is a home located in Coffey County with nearby schools including Burlington Elementary School, Burlington Middle School, and Burlington High School.
Ownership History
Date
Name
Owned For
Owner Type
Purchase Details
Closed on
Jan 20, 2015
Bought by
Klamberg Robert J and Klamberg Kristina K
Current Estimated Value
Create a Home Valuation Report for This Property
The Home Valuation Report is an in-depth analysis detailing your home's value as well as a comparison with similar homes in the area
Home Values in the Area
Average Home Value in this Area
Purchase History
| Date | Buyer | Sale Price | Title Company |
|---|---|---|---|
| Klamberg Robert J | $83,000 | -- |
Source: Public Records
Tax History Compared to Growth
Tax History
| Year | Tax Paid | Tax Assessment Tax Assessment Total Assessment is a certain percentage of the fair market value that is determined by local assessors to be the total taxable value of land and additions on the property. | Land | Improvement |
|---|---|---|---|---|
| 2025 | $1,590 | $14,194 | $776 | $13,418 |
| 2024 | $14 | $12,714 | $776 | $11,938 |
| 2023 | $1,340 | $11,057 | $311 | $10,746 |
| 2022 | $1,205 | $10,530 | $311 | $10,219 |
| 2021 | $1,205 | $9,777 | $311 | $9,466 |
| 2020 | $1,205 | $9,870 | $311 | $9,559 |
| 2019 | $1,182 | $9,546 | $311 | $9,235 |
| 2018 | $1,181 | $9,429 | $273 | $9,156 |
| 2017 | $1,181 | $9,545 | $273 | $9,272 |
| 2016 | $1,190 | $9,545 | $274 | $9,271 |
| 2015 | -- | $9,371 | $251 | $9,120 |
| 2014 | -- | $8,499 | $251 | $8,248 |
Source: Public Records
Map
Nearby Homes
- 815 Niagara St
- 302 S 8th St
- 821 Niagara St
- 802 Saint Lawrence St
- 216 S 8th St
- 825 Niagara St
- 812 Niagara St
- 818 Niagara St
- 727 Niagara St
- 210 S 8th St
- 217 S 9th St
- 726 Saint Lawrence St
- 723 Niagara St
- 717 Niagara St
- 811 Saint Lawrence St
- 815 Saint Lawrence St
- 720 Saint Lawrence St
- 300 S 9th St
- 801 Saint Lawrence St
- 817 Des Moines St