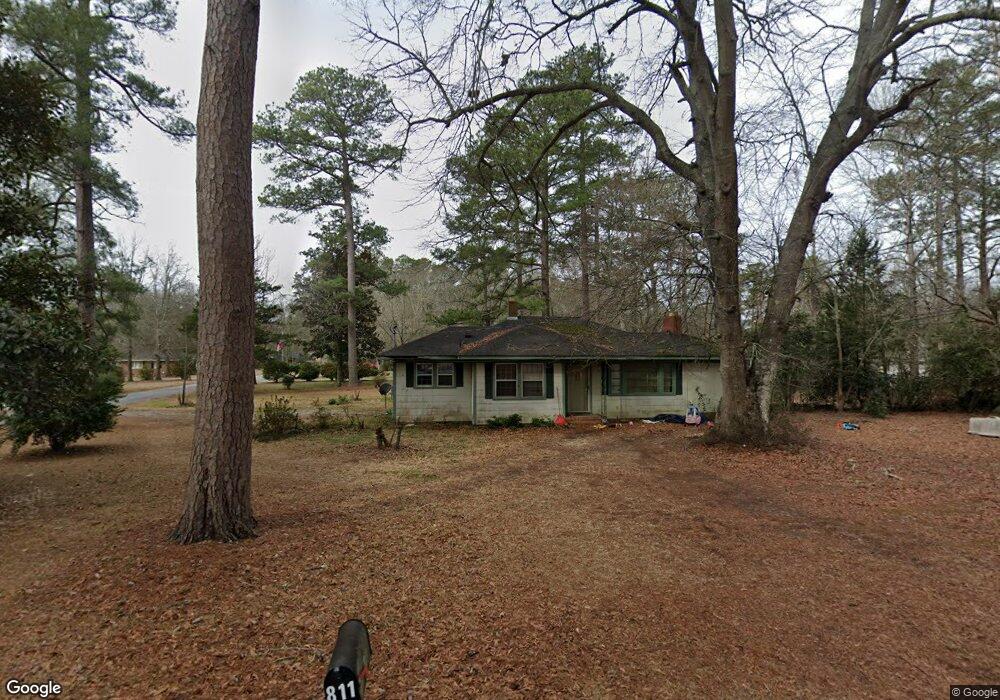
811 Pine Lane Dr Thomson, GA 30824
Estimated Value: $97,011 - $152,000
2
Beds
1
Bath
1,000
Sq Ft
$127/Sq Ft
Est. Value
About This Home
This home is located at 811 Pine Lane Dr, Thomson, GA 30824 and is currently estimated at $126,503, approximately $126 per square foot. 811 Pine Lane Dr is a home located in McDuffie County with nearby schools including Thomson High School.
Ownership History
Date
Name
Owned For
Owner Type
Purchase Details
Closed on
Jul 20, 2005
Sold by
Williamson Tony M
Bought by
Combs Howard
Current Estimated Value
Home Financials for this Owner
Home Financials are based on the most recent Mortgage that was taken out on this home.
Original Mortgage
$58,974
Outstanding Balance
$30,095
Interest Rate
5.51%
Mortgage Type
FHA
Estimated Equity
$96,408
Purchase Details
Closed on
Dec 22, 2004
Sold by
Williamson Meryl A
Bought by
Williamson Tony M
Purchase Details
Closed on
Sep 16, 1978
Bought by
Williamson Meryl A
Create a Home Valuation Report for This Property
The Home Valuation Report is an in-depth analysis detailing your home's value as well as a comparison with similar homes in the area
Home Values in the Area
Average Home Value in this Area
Purchase History
| Date | Buyer | Sale Price | Title Company |
|---|---|---|---|
| Combs Howard | $59,900 | -- | |
| Williamson Tony M | -- | -- | |
| Williamson Meryl A | -- | -- |
Source: Public Records
Mortgage History
| Date | Status | Borrower | Loan Amount |
|---|---|---|---|
| Open | Combs Howard | $58,974 |
Source: Public Records
Tax History
| Year | Tax Paid | Tax Assessment Tax Assessment Total Assessment is a certain percentage of the fair market value that is determined by local assessors to be the total taxable value of land and additions on the property. | Land | Improvement |
|---|---|---|---|---|
| 2025 | $981 | $31,062 | $4,319 | $26,743 |
| 2024 | $981 | $29,148 | $3,729 | $25,419 |
| 2023 | $933 | $27,979 | $3,540 | $24,439 |
| 2022 | $649 | $18,370 | $2,360 | $16,010 |
| 2021 | $527 | $14,811 | $2,360 | $12,451 |
| 2020 | $817 | $23,294 | $10,479 | $12,815 |
| 2019 | $897 | $25,363 | $10,479 | $14,884 |
| 2018 | $907 | $25,363 | $10,479 | $14,884 |
| 2017 | $882 | $25,363 | $10,479 | $14,884 |
| 2016 | $888 | $25,363 | $10,479 | $14,884 |
| 2015 | $788 | $25,362 | $10,479 | $14,884 |
| 2014 | $790 | $25,363 | $10,479 | $14,884 |
| 2013 | -- | $25,362 | $10,478 | $14,884 |
Source: Public Records
Map
Nearby Homes
- 306 Michael St
- 118 Langham St
- 462 Bussey Ave
- 609 Hillcrest Dr
- 0 Wrens Hwy Unit 10652460
- 0 Wrens Hwy Unit 549833
- 421 Salem Rd
- 410 Johns Rd
- 426 Salem Rd
- 509 Fluker St
- 354 King St
- 403 Fluker St
- 67 Shadowmoor Cir
- 119 Georgia Ave
- 219 White Oak St
- 123 Lee St
- 125 Lee St
- 535 White Oak St
- 318 White Oak St
- 000 Wrens Hwy
- 206 Lynda Ln
- 805 Pine Lane Dr
- 819 Pine Lane Dr
- 300 Michael St
- 207 Carroll St
- 209 Lynda Ln
- 201 Carroll St
- 818 Pine Lane Dr
- 307 Michael St
- 121 Lynda Ln
- 717 Pine Lane Dr
- 720 Pine Lane Dr
- 125 Carroll St
- 118 Lynda Ln
- 310 Michael St
- 313 Michael St
- 202 Carroll St
- 807 Austin St
- 0 Carroll St
- 841 Pine Lane Dr
Your Personal Tour Guide
Ask me questions while you tour the home.