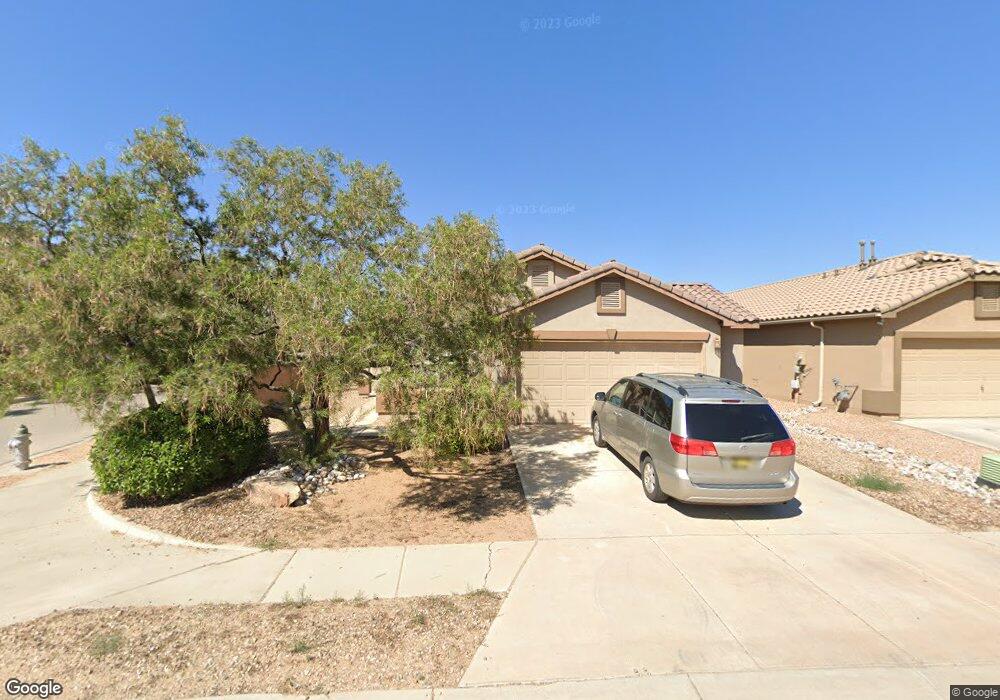
811 Purple Aster Ave SW Los Lunas, NM 87031
West Los Lunas NeighborhoodEstimated Value: $283,000 - $306,154
3
Beds
2
Baths
1,555
Sq Ft
$190/Sq Ft
Est. Value
About This Home
This home is located at 811 Purple Aster Ave SW, Los Lunas, NM 87031 and is currently estimated at $294,789, approximately $189 per square foot. 811 Purple Aster Ave SW is a home located in Valencia County with nearby schools including Sundance Elementary School, Los Lunas Middle School, and Los Lunas High School.
Ownership History
Date
Name
Owned For
Owner Type
Purchase Details
Closed on
Jan 26, 2022
Sold by
D R Horton Inc
Bought by
Lafleur Nicole C
Current Estimated Value
Purchase Details
Closed on
Sep 7, 2017
Sold by
Dr Horton Inc
Bought by
Subdivison Desert Willow
Purchase Details
Closed on
Sep 20, 2012
Sold by
Richardson Becky A
Bought by
Richardson William C
Home Financials for this Owner
Home Financials are based on the most recent Mortgage that was taken out on this home.
Original Mortgage
$177,313
Interest Rate
2.5%
Mortgage Type
VA
Purchase Details
Closed on
Nov 21, 2008
Sold by
D R Horton Inc
Bought by
Richardson William C and Richardson Becky A
Home Financials for this Owner
Home Financials are based on the most recent Mortgage that was taken out on this home.
Original Mortgage
$176,565
Interest Rate
5.98%
Mortgage Type
VA
Create a Home Valuation Report for This Property
The Home Valuation Report is an in-depth analysis detailing your home's value as well as a comparison with similar homes in the area
Home Values in the Area
Average Home Value in this Area
Purchase History
| Date | Buyer | Sale Price | Title Company |
|---|---|---|---|
| Lafleur Nicole C | -- | None Listed On Document | |
| Subdivison Desert Willow | -- | Fidelity Nat Title Ins Co | |
| Richardson William C | -- | None Available | |
| Richardson William C | -- | None Available |
Source: Public Records
Mortgage History
| Date | Status | Borrower | Loan Amount |
|---|---|---|---|
| Previous Owner | Richardson William C | $177,313 | |
| Previous Owner | Richardson William C | $176,565 |
Source: Public Records
Tax History Compared to Growth
Tax History
| Year | Tax Paid | Tax Assessment Tax Assessment Total Assessment is a certain percentage of the fair market value that is determined by local assessors to be the total taxable value of land and additions on the property. | Land | Improvement |
|---|---|---|---|---|
| 2024 | $2,182 | $65,889 | $11,597 | $54,292 |
| 2023 | $2,104 | $63,970 | $10,787 | $53,183 |
| 2022 | $2,070 | $62,107 | $10,000 | $52,107 |
| 2021 | $2,028 | $60,299 | $10,300 | $49,999 |
| 2020 | $2,007 | $58,542 | $10,000 | $48,542 |
| 2019 | $2,018 | $58,542 | $10,000 | $48,542 |
| 2018 | $1,968 | $58,542 | $10,000 | $48,542 |
| 2017 | $1,763 | $53,261 | $12,749 | $40,512 |
| 2016 | -- | $53,261 | $12,749 | $40,512 |
| 2015 | -- | $53,261 | $12,749 | $40,512 |
| 2013 | -- | $53,261 | $12,749 | $40,512 |
| 2011 | -- | $158,670 | $37,134 | $121,536 |
Source: Public Records
Map
Nearby Homes
- Sandia Plan at The Trails at El Cerro
- Bandera Plan at The Trails at El Cerro
- Alameda Plan at The Trails at El Cerro
- Manzano Plan at The Trails at El Cerro
- 3601 Santa fe Trail SW
- 3621 Santa fe Trail SW
- 3640 Santa fe Trail SW
- 1100 Vista de Bosque SW
- 3700 Santa fe Trail SW
- 680 Purple Aster Ave SW
- Paloma Plan at The Bluffs at El Cerro
- Mariposa Plan at The Bluffs at El Cerro
- Aguila Plan at The Bluffs at El Cerro
- 3771 Santa fe Trail SW
- 3271 Prairie Ridge St SW
- 3781 Santa fe Trail SW
- 1200 Vista de Bosque SW
- 3198 Prairie Ridge St SW
- 750 Creekside Ave SW
- 3787 Tayrien Ct SW
- 801 Purple Aster Ave SW
- 791 Purple Aster Ave SW
- 841 Purple Aster Ave SW
- 810 Desert Senna Ave SW
- 800 Desert Senna Ave SW
- 790 Desert Senna Ave SW
- 771 Purple Aster Ave SW
- 840 Desert Senna Ave SW
- 851 Purple Aster Ave SW
- 810 Purple Aster Ave SW
- 800 Purple Aster Ave SW
- 820 Purple Aster Ave SW
- 790 Purple Aster Ave SW
- 761 Purple Aster Ave SW
- 850 Desert Senna Ave SW
- 861 Purple Aster Ave SW
- 840 Purple Aster Ave SW
- 770 Purple Aster Ave SW
- 760 Desert Senna Ave SW
- 850 Purple Aster Ave SW