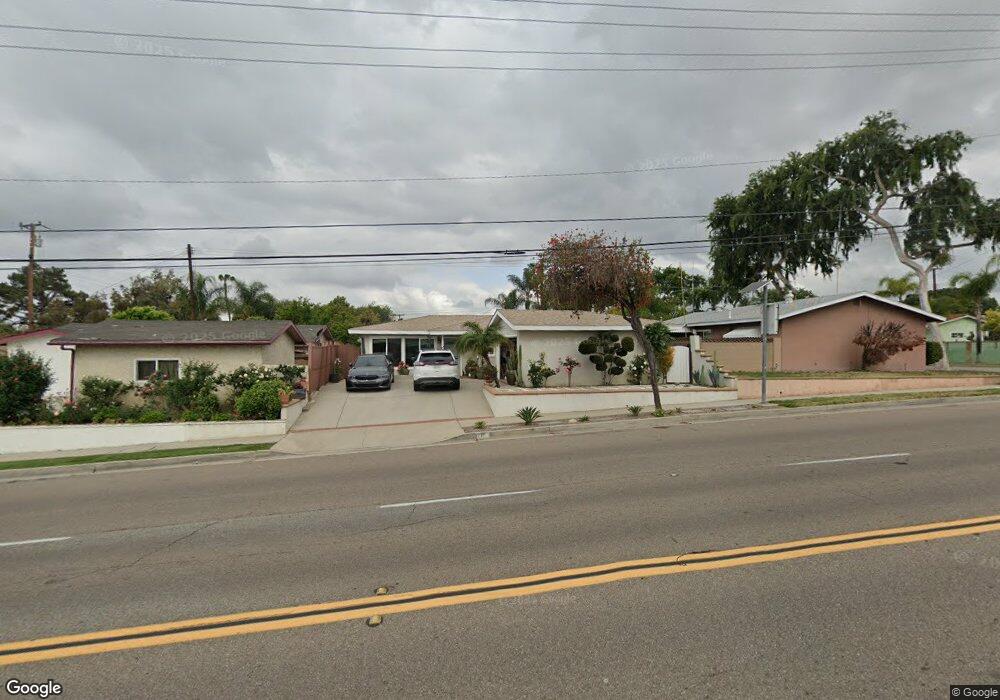
811 S Euclid St La Habra, CA 90631
Estimated Value: $765,000 - $798,000
3
Beds
2
Baths
1,269
Sq Ft
$614/Sq Ft
Est. Value
About This Home
This home is located at 811 S Euclid St, La Habra, CA 90631 and is currently estimated at $779,593, approximately $614 per square foot. 811 S Euclid St is a home located in Orange County with nearby schools including Las Lomas Elementary School, Imperial Middle School, and La Habra High School.
Ownership History
Date
Name
Owned For
Owner Type
Purchase Details
Closed on
Oct 29, 2019
Sold by
Bustos Araceli Maria Moreno and Arroyas Araceli M
Bought by
Bustos Araceli Maria Moreno and Bustos Araceli Maria
Current Estimated Value
Purchase Details
Closed on
Jun 10, 2013
Sold by
Velazquez Israel Bustos
Bought by
Bustos Araceli Maria Moreno
Home Financials for this Owner
Home Financials are based on the most recent Mortgage that was taken out on this home.
Original Mortgage
$204,000
Outstanding Balance
$95,359
Interest Rate
3.32%
Mortgage Type
New Conventional
Estimated Equity
$684,234
Purchase Details
Closed on
Jul 3, 2002
Sold by
Wansor Norman E
Bought by
Arroyas Araceli M
Home Financials for this Owner
Home Financials are based on the most recent Mortgage that was taken out on this home.
Original Mortgage
$199,200
Interest Rate
6.52%
Create a Home Valuation Report for This Property
The Home Valuation Report is an in-depth analysis detailing your home's value as well as a comparison with similar homes in the area
Home Values in the Area
Average Home Value in this Area
Purchase History
| Date | Buyer | Sale Price | Title Company |
|---|---|---|---|
| Bustos Araceli Maria Moreno | -- | None Available | |
| Bustos Araceli Maria Moreno | -- | Lawyers Title | |
| Arroyas Araceli M | $249,000 | First American Title Co |
Source: Public Records
Mortgage History
| Date | Status | Borrower | Loan Amount |
|---|---|---|---|
| Open | Bustos Araceli Maria Moreno | $204,000 | |
| Previous Owner | Arroyas Araceli M | $199,200 | |
| Closed | Arroyas Araceli M | $24,900 |
Source: Public Records
Tax History Compared to Growth
Tax History
| Year | Tax Paid | Tax Assessment Tax Assessment Total Assessment is a certain percentage of the fair market value that is determined by local assessors to be the total taxable value of land and additions on the property. | Land | Improvement |
|---|---|---|---|---|
| 2025 | $4,533 | $395,956 | $297,592 | $98,364 |
| 2024 | $4,533 | $388,193 | $291,757 | $96,436 |
| 2023 | $4,427 | $380,582 | $286,036 | $94,546 |
| 2022 | $4,379 | $373,120 | $280,427 | $92,693 |
| 2021 | $4,307 | $365,804 | $274,928 | $90,876 |
| 2020 | $4,265 | $362,054 | $272,109 | $89,945 |
| 2019 | $4,148 | $354,955 | $266,773 | $88,182 |
| 2018 | $3,738 | $316,941 | $261,543 | $55,398 |
| 2017 | $3,670 | $310,727 | $256,415 | $54,312 |
| 2016 | $3,583 | $304,635 | $251,387 | $53,248 |
| 2015 | $3,481 | $300,060 | $247,611 | $52,449 |
| 2014 | $3,377 | $294,183 | $242,761 | $51,422 |
Source: Public Records
Map
Nearby Homes
- 601 S Euclid St Unit 4
- 621 S Olive Ave
- 211 W Mountain View Ave
- 401 Buena Vista Ave
- 208 W Olive Ave Unit B
- 405 W Mountain View Ave
- 405 W Mountain View Ave Unit 13
- 300 Vista Dr Unit 94
- 418 W Olive Ave
- 414 W Olive Ave
- 287 Vista Dr Unit 69
- 630 W Lambert Rd Unit 24
- 708 W Lambert Rd Unit 6
- 303 S Cadiz Ct
- 641 Buena Vista Ave
- 1001 W Lambert Rd Unit 179
- 1001 W Lambert Rd Unit 127
- 1001 W Lambert Rd Unit 116
- 1001 W Lambert Rd Unit 284
- 1001 W Lambert Rd Unit 87
- 821 S Euclid St
- 100 W Rosecrest Ave
- 120 W Rosecrest Ave
- 831 S Euclid St
- 130 W Rosecrest Ave
- 100 E Rosecrest Ave
- 101 Grace Ave
- 771 S Euclid St
- 140 W Rosecrest Ave
- 110 E Rosecrest Ave
- 770 El Nido St
- 111 Grace Ave
- 770 S Euclid St
- 200 W Rosecrest Ave
- 760 El Nido St
- 120 E Rosecrest Ave
- 121 Grace Ave
- 761 S Euclid St
- 760 S Euclid St
- 131 Grace Ave