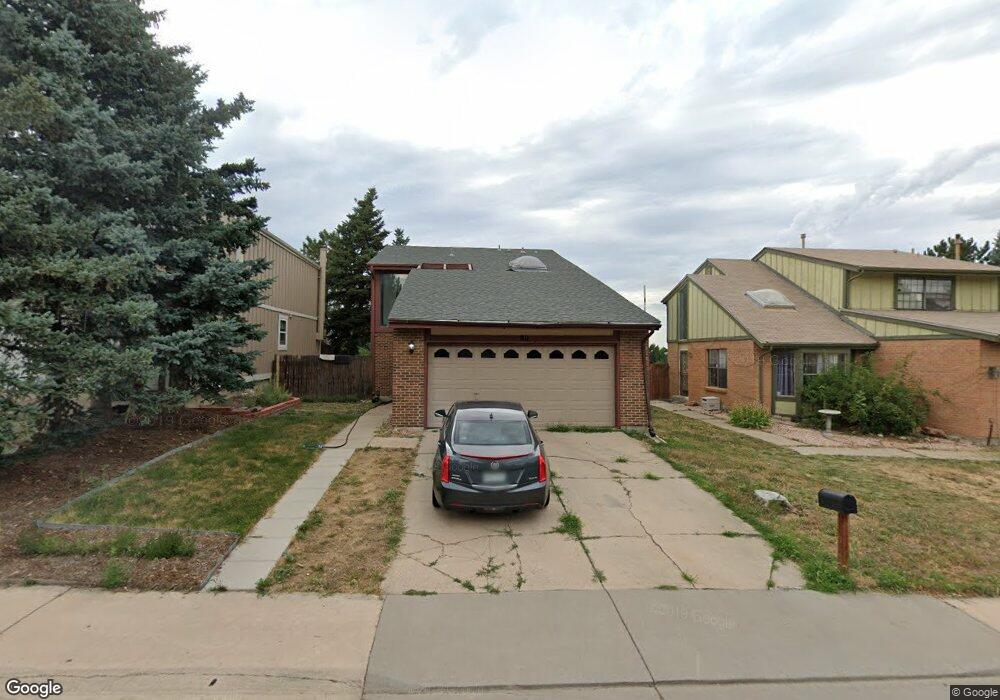
811 S Rifle Way Aurora, CO 80017
Tollgate Overlook NeighborhoodEstimated Value: $476,000 - $489,000
3
Beds
4
Baths
2,400
Sq Ft
$201/Sq Ft
Est. Value
About This Home
This home is located at 811 S Rifle Way, Aurora, CO 80017 and is currently estimated at $481,790, approximately $200 per square foot. 811 S Rifle Way is a home located in Arapahoe County with nearby schools including Iowa Elementary School, Mrachek Middle School, and Gateway High School.
Ownership History
Date
Name
Owned For
Owner Type
Purchase Details
Closed on
Dec 2, 2020
Sold by
Sperling Johnson Detlef J and Johnson Joseph J
Bought by
Sperling Johnson Detlef J and Martinez Bree Ann
Current Estimated Value
Home Financials for this Owner
Home Financials are based on the most recent Mortgage that was taken out on this home.
Original Mortgage
$285,000
Outstanding Balance
$254,187
Interest Rate
2.8%
Mortgage Type
New Conventional
Estimated Equity
$227,603
Purchase Details
Closed on
May 26, 2017
Sold by
Mihney Llc
Bought by
Johnson Detlef J Sperling and Johnson Joseph J
Home Financials for this Owner
Home Financials are based on the most recent Mortgage that was taken out on this home.
Original Mortgage
$294,566
Interest Rate
4.25%
Mortgage Type
FHA
Purchase Details
Closed on
Feb 9, 2015
Sold by
Mihneva Milena
Bought by
Mihnev Llc
Home Financials for this Owner
Home Financials are based on the most recent Mortgage that was taken out on this home.
Original Mortgage
$231,100
Interest Rate
3.25%
Mortgage Type
FHA
Purchase Details
Closed on
Feb 25, 2013
Sold by
Hartman Deanna C
Bought by
Quinlan Patrick J
Purchase Details
Closed on
Jan 4, 2013
Sold by
Hartman Deanna C
Bought by
Quinlan Patrick J
Purchase Details
Closed on
Jul 9, 2009
Sold by
Quinlan Patrick
Bought by
Hartman Deanna
Purchase Details
Closed on
Jun 16, 2008
Sold by
Wells Fargo Bank Na
Bought by
Quinlan Patrick and Hartman Deanna
Purchase Details
Closed on
Jun 22, 1990
Sold by
Secretary Of Housing & Urban Dev
Bought by
Hundon Linda Kay
Purchase Details
Closed on
Oct 11, 1989
Sold by
Conversion Arapco
Bought by
Secretary Of Housing & Urban Dev
Purchase Details
Closed on
Apr 1, 1985
Sold by
Conversion Arapco
Bought by
Conversion Arapco
Purchase Details
Closed on
Feb 1, 1985
Sold by
Conversion Arapco
Bought by
Conversion Arapco
Purchase Details
Closed on
May 1, 1980
Sold by
Conversion Arapco
Bought by
Conversion Arapco
Purchase Details
Closed on
Jul 4, 1776
Bought by
Conversion Arapco
Create a Home Valuation Report for This Property
The Home Valuation Report is an in-depth analysis detailing your home's value as well as a comparison with similar homes in the area
Home Values in the Area
Average Home Value in this Area
Purchase History
| Date | Buyer | Sale Price | Title Company |
|---|---|---|---|
| Sperling Johnson Detlef J | -- | None Available | |
| Johnson Detlef J Sperling | $300,000 | Fidelity National Title | |
| Mihnev Llc | -- | None Available | |
| Mihneva Milena | $239,500 | Land Title Guarantee Company | |
| Quinlan Patrick J | -- | None Available | |
| Quinlan Patrick J | -- | None Available | |
| Hartman Deanna | -- | None Available | |
| Quinlan Patrick | $102,375 | None Available | |
| Hundon Linda Kay | -- | -- | |
| Secretary Of Housing & Urban Dev | -- | -- | |
| Conversion Arapco | -- | -- | |
| Conversion Arapco | -- | -- | |
| Conversion Arapco | -- | -- | |
| Conversion Arapco | -- | -- |
Source: Public Records
Mortgage History
| Date | Status | Borrower | Loan Amount |
|---|---|---|---|
| Open | Sperling Johnson Detlef J | $285,000 | |
| Closed | Johnson Detlef J Sperling | $294,566 | |
| Previous Owner | Mihneva Milena | $231,100 |
Source: Public Records
Tax History Compared to Growth
Tax History
| Year | Tax Paid | Tax Assessment Tax Assessment Total Assessment is a certain percentage of the fair market value that is determined by local assessors to be the total taxable value of land and additions on the property. | Land | Improvement |
|---|---|---|---|---|
| 2024 | $2,843 | $30,592 | -- | -- |
| 2023 | $2,843 | $30,592 | $0 | $0 |
| 2022 | $2,579 | $25,680 | $0 | $0 |
| 2021 | $2,662 | $25,680 | $0 | $0 |
| 2020 | $2,415 | $23,195 | $0 | $0 |
| 2019 | $2,402 | $23,195 | $0 | $0 |
| 2018 | $1,922 | $18,173 | $0 | $0 |
| 2017 | $1,672 | $18,173 | $0 | $0 |
| 2016 | $1,442 | $15,347 | $0 | $0 |
| 2015 | $1,392 | $15,347 | $0 | $0 |
| 2014 | $1,019 | $10,818 | $0 | $0 |
| 2013 | -- | $12,840 | $0 | $0 |
Source: Public Records
Map
Nearby Homes
- 17714 E Ada Dr
- 18003 E Ohio Ave Unit 102
- 18004 E Ohio Ave Unit 101
- 18033 E Ohio Ave Unit 201
- 18043 E Ohio Ave Unit 202
- 17775 E Tennessee Dr
- 18064 E Ohio Ave Unit 104
- 18073 E Ohio Ave Unit 203
- 18063 E Ohio Ave Unit 201
- 18105 E Ohio Ave Unit 204
- 977 S Salida St
- 18103 E Kentucky Ave Unit 203
- 461 S Salida St
- 449 S Salida St
- 17094 E Virginia Ave
- 17256 E Ford Dr
- 17274 E Ford Dr
- 17216 E Alameda Pkwy
- 17095 E Alameda Pkwy
- 18064 E Ford Place
- 803 S Rifle Way
- 813 S Rifle Way
- 821 S Rifle Way
- 801 S Rifle Way
- 823 S Rifle Way
- 17603 E Ohio Cir
- 804 S Rifle Way
- 812 S Rifle Way
- 831 S Rifle Way
- 822 S Rifle Way
- 17605 E Ohio Cir
- 833 S Rifle Way
- 838 S Rifle Ct
- 17561 E Ohio Cir
- 17604 E Ohio Cir
- 17592 E Ohio Cir
- 17582 E Ohio Cir
- 848 S Rifle Ct
- 17614 E Ohio Cir
- 841 S Rifle Way