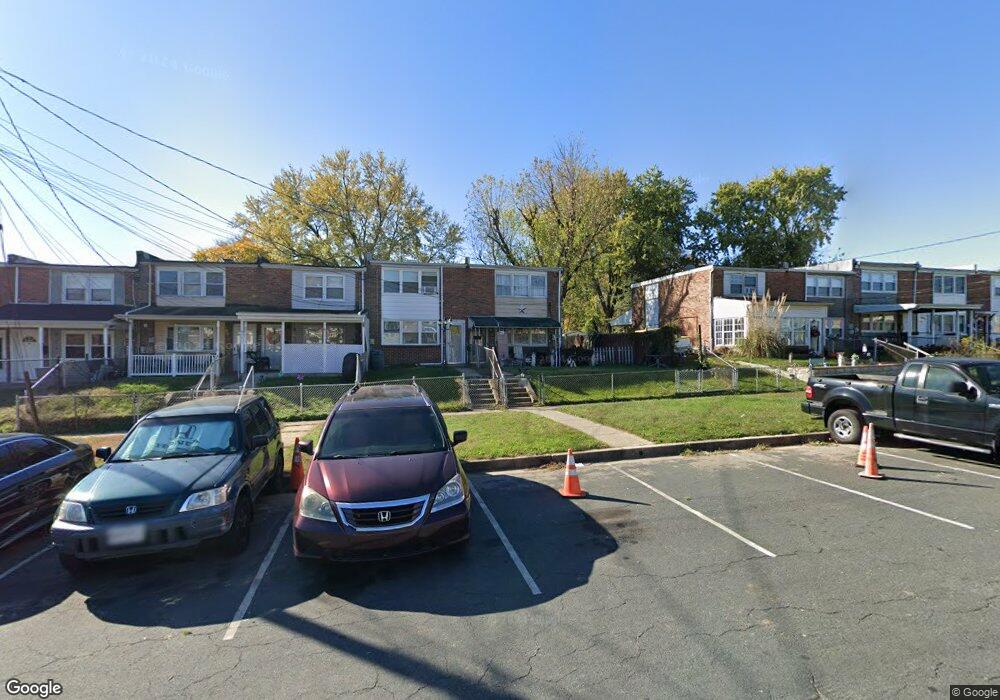
811 Seckel Ct Halethorpe, MD 21227
Lansdowne NeighborhoodEstimated Value: $126,582 - $185,000
--
Bed
1
Bath
1,024
Sq Ft
$152/Sq Ft
Est. Value
About This Home
This home is located at 811 Seckel Ct, Halethorpe, MD 21227 and is currently estimated at $155,146, approximately $151 per square foot. 811 Seckel Ct is a home located in Baltimore County with nearby schools including Riverview Elementary School, Lansdowne Middle School, and Lansdowne High School.
Ownership History
Date
Name
Owned For
Owner Type
Purchase Details
Closed on
Aug 1, 2025
Sold by
Hoch James Gary
Bought by
Hoch James Gary and Hoch Wilhelmina M
Current Estimated Value
Purchase Details
Closed on
Aug 10, 2001
Sold by
Hoch James Gary
Bought by
Hoch James Gary
Purchase Details
Closed on
May 29, 1991
Sold by
Underwood Joseph K
Bought by
Hoch James Gary
Create a Home Valuation Report for This Property
The Home Valuation Report is an in-depth analysis detailing your home's value as well as a comparison with similar homes in the area
Home Values in the Area
Average Home Value in this Area
Purchase History
| Date | Buyer | Sale Price | Title Company |
|---|---|---|---|
| Hoch James Gary | -- | None Listed On Document | |
| Hoch James Gary | -- | None Listed On Document | |
| Hoch James Gary | -- | -- | |
| Hoch James Gary | $66,500 | -- |
Source: Public Records
Tax History Compared to Growth
Tax History
| Year | Tax Paid | Tax Assessment Tax Assessment Total Assessment is a certain percentage of the fair market value that is determined by local assessors to be the total taxable value of land and additions on the property. | Land | Improvement |
|---|---|---|---|---|
| 2025 | $1,958 | $117,533 | -- | -- |
| 2024 | $1,958 | $107,100 | $37,400 | $69,700 |
| 2023 | $897 | $104,000 | $0 | $0 |
| 2022 | $1,709 | $100,900 | $0 | $0 |
| 2021 | $2,119 | $97,800 | $37,400 | $60,400 |
| 2020 | $2,119 | $95,700 | $0 | $0 |
| 2019 | $2,042 | $93,600 | $0 | $0 |
| 2018 | $1,674 | $91,500 | $37,400 | $54,100 |
| 2017 | $1,738 | $89,267 | $0 | $0 |
| 2016 | $1,288 | $87,033 | $0 | $0 |
| 2015 | $1,288 | $84,800 | $0 | $0 |
| 2014 | $1,288 | $84,800 | $0 | $0 |
Source: Public Records
Map
Nearby Homes
- 4157 Hollins Ferry Rd
- 4007 Hollins Ferry Rd
- 3055 Freeway
- 3103 Ryerson Cir
- 430 Burbank Ct
- 3311 Kessler Ct
- 323 Third Ave
- 3507 Clover Ave
- 130 5th Ave
- 4101 Oak Rd
- 4435 Scotia Rd
- 2423 Alma Rd
- 108 4th Ave
- 121 3rd Ave
- 216 Clyde Ave
- 4415 Norfen Rd
- 4322 Annapolis Rd
- 121 1st Ave
- 2725 Yarnall Rd
- 4344 Annapolis Rd