811 Sydney Ct Gilroy, CA 95020
Estimated Value: $1,073,000 - $1,363,000
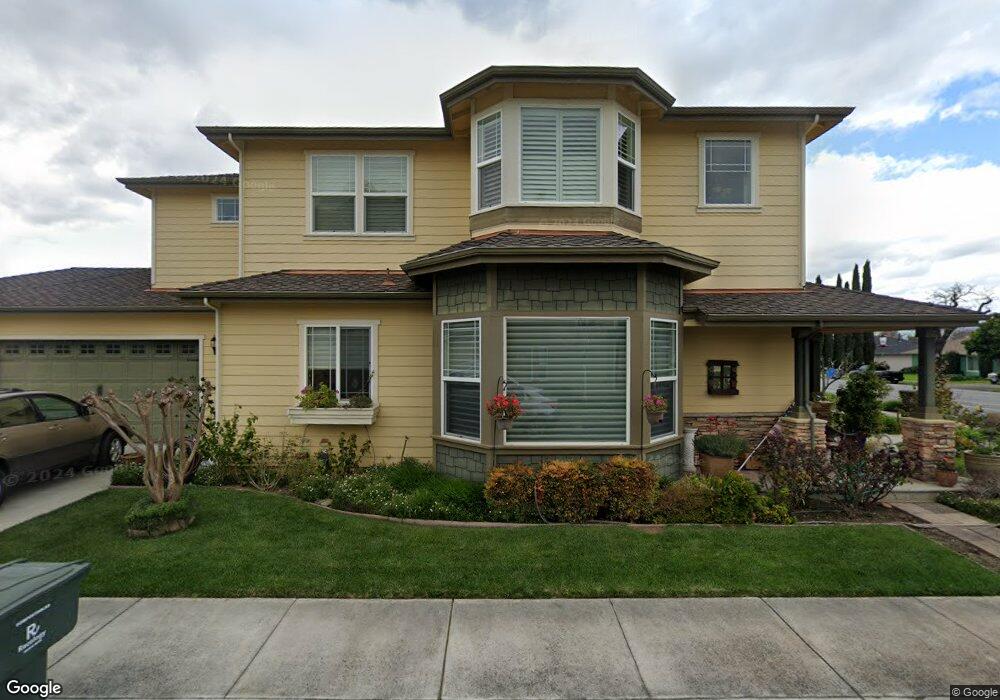
About This Home
This home is located at 811 Sydney Ct, Gilroy, CA 95020 and is currently estimated at $1,192,976, approximately $529 per square foot. 811 Sydney Ct is a home located in Santa Clara County with nearby schools including El Roble Elementary School, Brownell Middle School, and Solorsano Middle School.
Ownership History
We collect this data history from publicly available records. To have your information removed, we recommend requesting removal directly through your county’s website.
Purchase Details
Purchase Details
Purchase Details
Purchase Details
Purchase Details
Home Values in the Area
Average Home Value in this Area
Purchase History
We collect this data history from publicly available records. To have your information removed, we recommend requesting removal directly through your county’s website.
| Date | Buyer | Sale Price | Title Company |
|---|---|---|---|
| -- | None Available | ||
| -- | None Available | ||
| -- | None Available | ||
| -- | None Available | ||
| $525,000 | Old Republic Title Company | ||
| -- | Old Republic Title Company | ||
| -- | Old Republic Title Company | ||
| -- | Old Republic Title Company | ||
| -- | Old Republic Title Company | ||
| -- | Old Republic Title Company |
Tax History
We collect this data history from publicly available records. To have your information removed, we recommend requesting removal directly through your county’s website.
| Year | Tax Paid | Tax Assessment Tax Assessment Total Assessment is a certain percentage of the fair market value that is determined by local assessors to be the total taxable value of land and additions on the property. | Land | Improvement |
|---|---|---|---|---|
| 2025 | $1,297 | $103,678 | $35,315 | $68,363 |
| 2024 | $1,297 | $101,646 | $34,623 | $67,023 |
| 2023 | $1,286 | $99,654 | $33,945 | $65,709 |
| 2022 | $1,262 | $97,701 | $33,280 | $64,421 |
| 2021 | $1,252 | $95,786 | $32,628 | $63,158 |
| 2020 | $1,237 | $94,805 | $32,294 | $62,511 |
| 2019 | $1,225 | $92,947 | $31,661 | $61,286 |
| 2018 | $1,147 | $91,126 | $31,041 | $60,085 |
| 2017 | $1,166 | $89,340 | $30,433 | $58,907 |
| 2016 | $1,131 | $87,589 | $29,837 | $57,752 |
| 2015 | $1,069 | $86,274 | $29,389 | $56,885 |
| 2014 | $1,060 | $84,585 | $28,814 | $55,771 |
Map
- 7934 Kipling Cir
- 704 Tennyson Dr
- 622 Broadway
- 620 Broadway
- 626 Broadway
- 7969 Kipling Cir
- 690 El Cerrito Way
- 7841 Rosanna St
- 60 Monte Vista Way
- 7691 Church St Unit B
- 140 2nd St
- 833 Welburn Ave
- 7490 Santa Theresa Dr Unit 10
- 700 Eschenburg Dr
- 1150 3rd St
- 1150 3rd St Unit 3rd
- 194 4th St
- 7711 Monterey St
- 263 5th St
- 7392 Ailes Ct
- 810 Sydney Ct
- 821 Sydney Ct
- 7911 Miller Ave
- 7890 Miller Ave
- 7880 Miller Ave
- 7900 Miller Ave
- 7930 Miller Ave
- 831 Sydney Ct
- 7841 Miller Ave
- 7860 Miller Ave
- 830 Sydney Ct
- 7940 Miller Ave
- 7850 Miller Ave
- 7831 Miller Ave
- 7840 Miller Ave
- 7901 Princevalle St
- 7891 Princevalle St
- 7931 Princevalle St
- 7881 Princevalle St
- 7941 Princevalle St
Ask me questions while you tour the home.