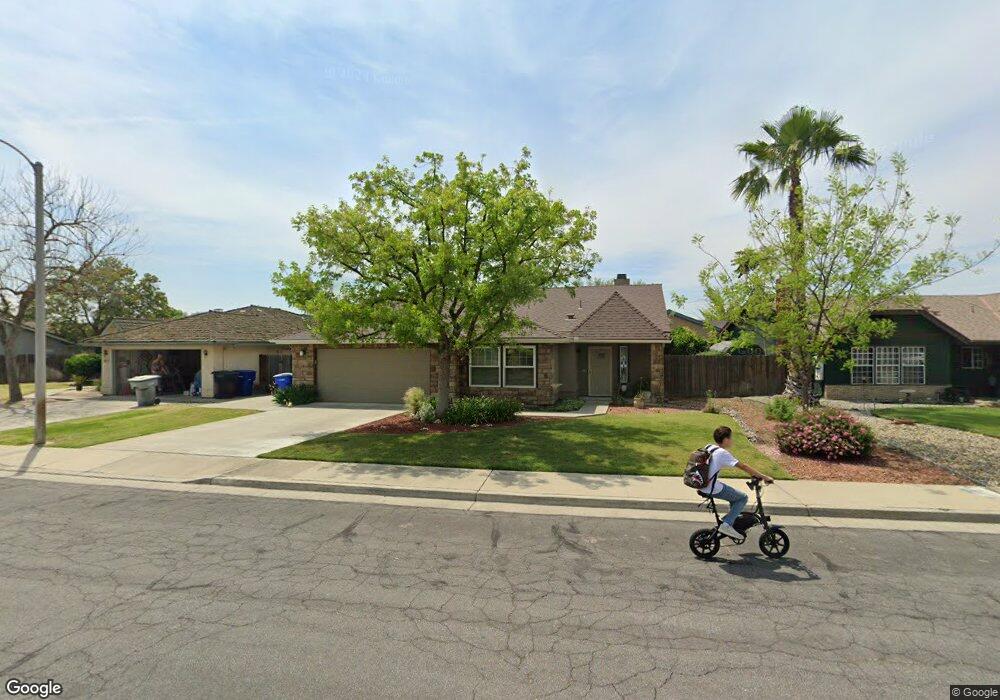
811 Tony Dr Hanford, CA 93230
Estimated Value: $373,000 - $391,000
3
Beds
2
Baths
1,679
Sq Ft
$226/Sq Ft
Est. Value
About This Home
This home is located at 811 Tony Dr, Hanford, CA 93230 and is currently estimated at $379,332, approximately $225 per square foot. 811 Tony Dr is a home located in Kings County with nearby schools including Hanford High School, Kings River-Hardwick Elementary School, and Pioneer Middle School.
Ownership History
Date
Name
Owned For
Owner Type
Purchase Details
Closed on
Aug 10, 2011
Sold by
Nation Barbara
Bought by
Sheldon Donna L
Current Estimated Value
Home Financials for this Owner
Home Financials are based on the most recent Mortgage that was taken out on this home.
Original Mortgage
$151,399
Outstanding Balance
$103,250
Interest Rate
4.25%
Mortgage Type
FHA
Estimated Equity
$276,082
Purchase Details
Closed on
Apr 6, 2001
Sold by
Merritt David M and Merritt Denise M
Bought by
Nation Barbara
Home Financials for this Owner
Home Financials are based on the most recent Mortgage that was taken out on this home.
Original Mortgage
$125,037
Interest Rate
7.09%
Create a Home Valuation Report for This Property
The Home Valuation Report is an in-depth analysis detailing your home's value as well as a comparison with similar homes in the area
Home Values in the Area
Average Home Value in this Area
Purchase History
| Date | Buyer | Sale Price | Title Company |
|---|---|---|---|
| Sheldon Donna L | $170,000 | Chicago Title Company | |
| Nation Barbara | $127,000 | First American Title Co |
Source: Public Records
Mortgage History
| Date | Status | Borrower | Loan Amount |
|---|---|---|---|
| Open | Sheldon Donna L | $151,399 | |
| Previous Owner | Nation Barbara | $125,037 |
Source: Public Records
Tax History Compared to Growth
Tax History
| Year | Tax Paid | Tax Assessment Tax Assessment Total Assessment is a certain percentage of the fair market value that is determined by local assessors to be the total taxable value of land and additions on the property. | Land | Improvement |
|---|---|---|---|---|
| 2025 | $2,283 | $213,402 | $73,980 | $139,422 |
| 2023 | $2,283 | $205,117 | $71,108 | $134,009 |
| 2022 | $2,200 | $201,096 | $69,714 | $131,382 |
| 2021 | $2,158 | $197,154 | $68,348 | $128,806 |
| 2020 | $2,156 | $195,132 | $67,647 | $127,485 |
| 2019 | $2,137 | $191,306 | $66,321 | $124,985 |
| 2018 | $2,099 | $187,555 | $65,021 | $122,534 |
| 2017 | $1,999 | $183,877 | $63,746 | $120,131 |
| 2016 | $1,946 | $180,271 | $62,496 | $117,775 |
| 2015 | $1,925 | $177,563 | $61,557 | $116,006 |
| 2014 | $1,897 | $174,085 | $60,351 | $113,734 |
Source: Public Records
Map
Nearby Homes