Estimated Value: $432,000 - $478,037
2
Beds
1
Bath
1,032
Sq Ft
$442/Sq Ft
Est. Value
About This Home
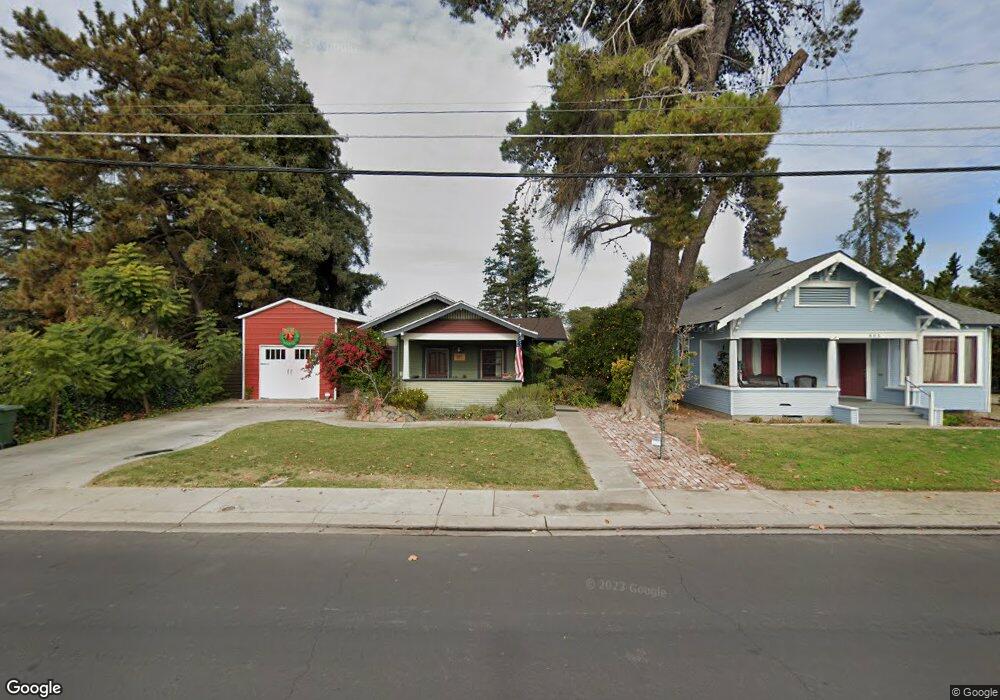
This home is located at 811 W 4th St, Ripon, CA 95366 and is currently estimated at $456,259, approximately $442 per square foot. 811 W 4th St is a home located in San Joaquin County with nearby schools including Ripon Elementary School, Weston Elementary School, and Park View Elementary School.
Ownership History
Date
Name
Owned For
Owner Type
Purchase Details
Closed on
Aug 6, 2020
Sold by
Hedegard Thomas R and Hedegard Janelle
Bought by
Hedegard Thomas and Hedegard Janelle
Current Estimated Value
Home Financials for this Owner
Home Financials are based on the most recent Mortgage that was taken out on this home.
Original Mortgage
$169,000
Outstanding Balance
$150,192
Interest Rate
3.1%
Mortgage Type
New Conventional
Estimated Equity
$306,067
Purchase Details
Closed on
Mar 24, 2014
Sold by
Hedegard Janelle and Deliddo Janelle
Bought by
Hedegard Thomas R and Hedegard Janelle
Home Financials for this Owner
Home Financials are based on the most recent Mortgage that was taken out on this home.
Original Mortgage
$183,383
Interest Rate
4.5%
Mortgage Type
FHA
Purchase Details
Closed on
Jul 22, 2008
Sold by
Schemper Clayton
Bought by
Deliddo Janelle
Home Financials for this Owner
Home Financials are based on the most recent Mortgage that was taken out on this home.
Original Mortgage
$196,910
Interest Rate
6.32%
Mortgage Type
FHA
Purchase Details
Closed on
Jul 18, 2008
Sold by
U S Bank Na
Bought by
Deliddo Janelle
Home Financials for this Owner
Home Financials are based on the most recent Mortgage that was taken out on this home.
Original Mortgage
$196,910
Interest Rate
6.32%
Mortgage Type
FHA
Purchase Details
Closed on
May 30, 2008
Sold by
Ulloa Guadalupe
Bought by
U S Bank Na and Citigroup Mortgage Loan Trust Inc
Home Financials for this Owner
Home Financials are based on the most recent Mortgage that was taken out on this home.
Original Mortgage
$196,910
Interest Rate
6.32%
Mortgage Type
FHA
Purchase Details
Closed on
Jul 7, 2006
Sold by
San Joaquin Housing Alliance Llc
Bought by
Ulloa Guadalupe
Home Financials for this Owner
Home Financials are based on the most recent Mortgage that was taken out on this home.
Original Mortgage
$256,000
Interest Rate
7%
Mortgage Type
Purchase Money Mortgage
Purchase Details
Closed on
Jan 5, 2006
Sold by
Secada Fred P and Secada Pamela S
Bought by
San Joaquin Housing Alliance Llc
Purchase Details
Closed on
Feb 11, 1998
Sold by
Pamela Secada
Bought by
Secada Frederick
Create a Home Valuation Report for This Property
The Home Valuation Report is an in-depth analysis detailing your home's value as well as a comparison with similar homes in the area
Home Values in the Area
Average Home Value in this Area
Purchase History
| Date | Buyer | Sale Price | Title Company |
|---|---|---|---|
| Hedegard Thomas | -- | Placer Title Company | |
| Hedegard Thomas R | -- | Old Republic Title Company | |
| Deliddo Janelle | -- | Landamerica Commonwealth | |
| Deliddo Janelle | $200,000 | Landamerica Commonwealth | |
| U S Bank Na | $225,000 | None Available | |
| Ulloa Guadalupe | $320,000 | Chicago Title Co | |
| San Joaquin Housing Alliance Llc | $230,000 | None Available | |
| Secada Frederick | -- | -- |
Source: Public Records
Mortgage History
| Date | Status | Borrower | Loan Amount |
|---|---|---|---|
| Open | Hedegard Thomas | $169,000 | |
| Closed | Hedegard Thomas R | $183,383 | |
| Closed | Deliddo Janelle | $196,910 | |
| Previous Owner | Ulloa Guadalupe | $256,000 |
Source: Public Records
Tax History
| Year | Tax Paid | Tax Assessment Tax Assessment Total Assessment is a certain percentage of the fair market value that is determined by local assessors to be the total taxable value of land and additions on the property. | Land | Improvement |
|---|---|---|---|---|
| 2025 | $3,300 | $308,103 | $77,259 | $230,844 |
| 2024 | $3,245 | $302,063 | $75,745 | $226,318 |
| 2023 | $3,178 | $296,141 | $74,260 | $221,881 |
| 2022 | $3,126 | $290,335 | $72,804 | $217,531 |
| 2021 | $2,815 | $260,133 | $71,377 | $188,756 |
| 2020 | $2,789 | $257,467 | $70,646 | $186,821 |
| 2019 | $2,740 | $252,419 | $69,261 | $183,158 |
| 2018 | $2,697 | $247,470 | $67,903 | $179,567 |
| 2017 | $2,644 | $242,619 | $66,572 | $176,047 |
| 2016 | $2,599 | $237,863 | $65,267 | $172,596 |
| 2015 | $2,218 | $202,000 | $55,000 | $147,000 |
| 2014 | $1,636 | $150,700 | $45,100 | $105,600 |
Source: Public Records
Map
Nearby Homes
- 136 N Acacia Ave
- 150 N Acacia Ave
- 205 3rd St
- 410 Pine St
- 138 Roxie Ct
- 23811 S Jack Tone Rd
- 924 Kingery Dr
- 1601 Stanley Dr
- 1621 Davis St
- 1315 Augusta Pointe Dr
- 1671 Davis St
- 1122 Zumstein Ct
- 244 California St
- 1434 Augusta Pointe Dr
- 336 Kristen Way
- 818 Travaille Way
- 1672 Bailey Dr
- 1080 Ruess Rd
- 663 Clay Way
- 163 Franklin Ln
Your Personal Tour Guide
Ask me questions while you tour the home.