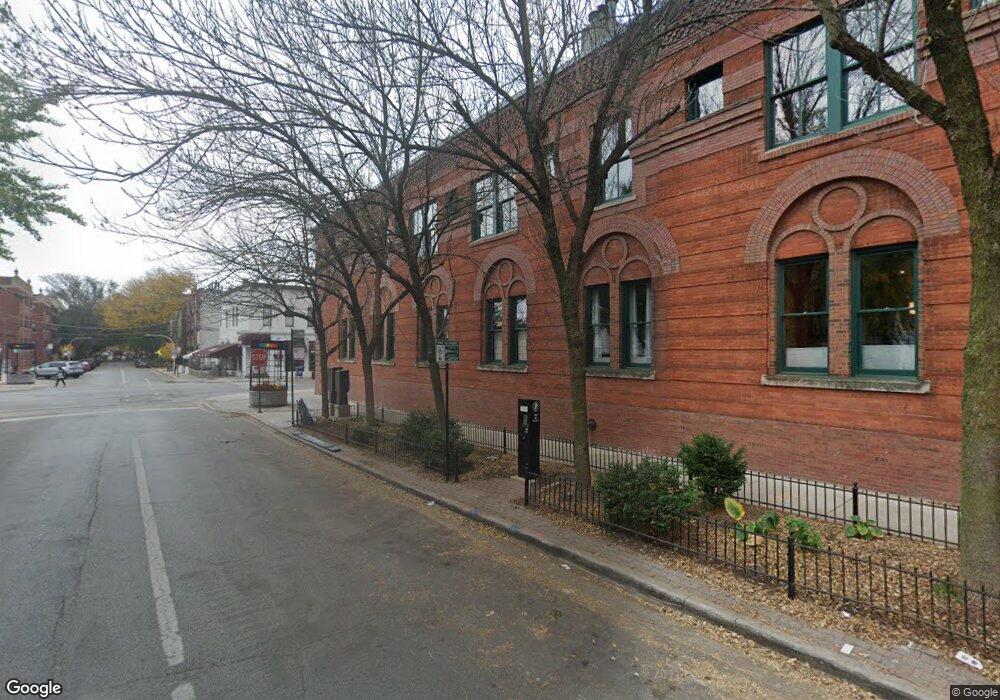
811 W Aldine Ave Unit 2S Chicago, IL 60657
Lakeview East NeighborhoodEstimated Value: $721,000 - $785,000
2
Beds
2
Baths
1,800
Sq Ft
$418/Sq Ft
Est. Value
About This Home
This home is located at 811 W Aldine Ave Unit 2S, Chicago, IL 60657 and is currently estimated at $751,627, approximately $417 per square foot. 811 W Aldine Ave Unit 2S is a home located in Cook County with nearby schools including Nettelhorst Elementary School, Lake View High School, and Our Lady Of Mount Carmel Academy.
Ownership History
Date
Name
Owned For
Owner Type
Purchase Details
Closed on
Jul 17, 2001
Sold by
Burg Daniel B
Bought by
Mccusker Patrick D and Mccusker Stacey S
Current Estimated Value
Home Financials for this Owner
Home Financials are based on the most recent Mortgage that was taken out on this home.
Original Mortgage
$370,000
Outstanding Balance
$143,417
Interest Rate
7.22%
Estimated Equity
$608,210
Purchase Details
Closed on
Jul 16, 1999
Sold by
Fair Donald G and Fair David Gwen
Bought by
Burg Daniel B
Home Financials for this Owner
Home Financials are based on the most recent Mortgage that was taken out on this home.
Original Mortgage
$333,600
Interest Rate
7%
Purchase Details
Closed on
Oct 21, 1994
Sold by
Lasalle National Trust Na
Bought by
Fair David O and Fair Donald G
Home Financials for this Owner
Home Financials are based on the most recent Mortgage that was taken out on this home.
Original Mortgage
$200,000
Interest Rate
8.86%
Create a Home Valuation Report for This Property
The Home Valuation Report is an in-depth analysis detailing your home's value as well as a comparison with similar homes in the area
Home Values in the Area
Average Home Value in this Area
Purchase History
| Date | Buyer | Sale Price | Title Company |
|---|---|---|---|
| Mccusker Patrick D | $462,500 | -- | |
| Burg Daniel B | $392,500 | Chicago Title Insurance Co | |
| Fair David O | $286,500 | -- |
Source: Public Records
Mortgage History
| Date | Status | Borrower | Loan Amount |
|---|---|---|---|
| Open | Mccusker Patrick D | $370,000 | |
| Previous Owner | Burg Daniel B | $333,600 | |
| Previous Owner | Fair David O | $200,000 | |
| Closed | Mccusker Patrick D | $23,125 |
Source: Public Records
Tax History Compared to Growth
Tax History
| Year | Tax Paid | Tax Assessment Tax Assessment Total Assessment is a certain percentage of the fair market value that is determined by local assessors to be the total taxable value of land and additions on the property. | Land | Improvement |
|---|---|---|---|---|
| 2024 | $15,140 | $72,262 | $17,798 | $54,464 |
| 2023 | $14,745 | $70,000 | $14,353 | $55,647 |
| 2022 | $14,745 | $70,000 | $14,353 | $55,647 |
| 2021 | $14,487 | $69,999 | $14,353 | $55,646 |
| 2020 | $10,354 | $46,211 | $6,123 | $40,088 |
| 2019 | $10,144 | $50,339 | $6,123 | $44,216 |
| 2018 | $9,983 | $50,339 | $6,123 | $44,216 |
| 2017 | $10,604 | $49,313 | $5,358 | $43,955 |
| 2016 | $10,033 | $49,313 | $5,358 | $43,955 |
| 2015 | $9,175 | $49,313 | $5,358 | $43,955 |
| 2014 | $10,319 | $54,111 | $4,377 | $49,734 |
| 2013 | $10,114 | $54,111 | $4,377 | $49,734 |
Source: Public Records
Map
Nearby Homes
- 3232 N Halsted St Unit H306
- 3232 N Halsted St Unit H206
- 3218 N Halsted St Unit 1S
- 3219 N Halsted St Unit C
- 835 W Buckingham Place Unit 2
- 730 W Aldine Ave Unit 3W
- 727 W Aldine Ave Unit 1
- 3260 N Clark St Unit 306
- 3161 N Halsted St Unit 202
- 901 W Belmont Ave
- 734 W Briar Place Unit 3
- 647 W Melrose St Unit 5
- 644 W Melrose St Unit 2E
- 862 W Roscoe St Unit 1
- 902 W Roscoe St Unit 4
- 904 W Fletcher St Unit 3
- 912 W Roscoe St Unit 1
- 754 W California Terrace Unit 1
- 754 W California Terrace Unit 3
- 916 W Fletcher St Unit C
- 811 W Aldine Ave Unit 5S
- 811 W Aldine Ave Unit 3N
- 811 W Aldine Ave Unit 6S
- 811 W Aldine Ave Unit 3S
- 811 W Aldine Ave Unit 5NF
- 811 W Aldine Ave Unit 6N
- 811 W Aldine Ave Unit 1N
- 811 W Aldine Ave Unit 7N
- 811 W Aldine Ave Unit 5N
- 811 W Aldine Ave Unit 2N
- 811 W Aldine Ave Unit 4S
- 811 W Aldine Ave Unit 1S
- 811 W Aldine Ave Unit 5ND
- 3250 N Halsted St
- 819 W Aldine Ave Unit 3
- 819 W Aldine Ave Unit 2
- 819 W Aldine Ave Unit 1
- 819 W Aldine Ave
- 3300 N Halsted St
- 3300 N Halsted St Unit 2