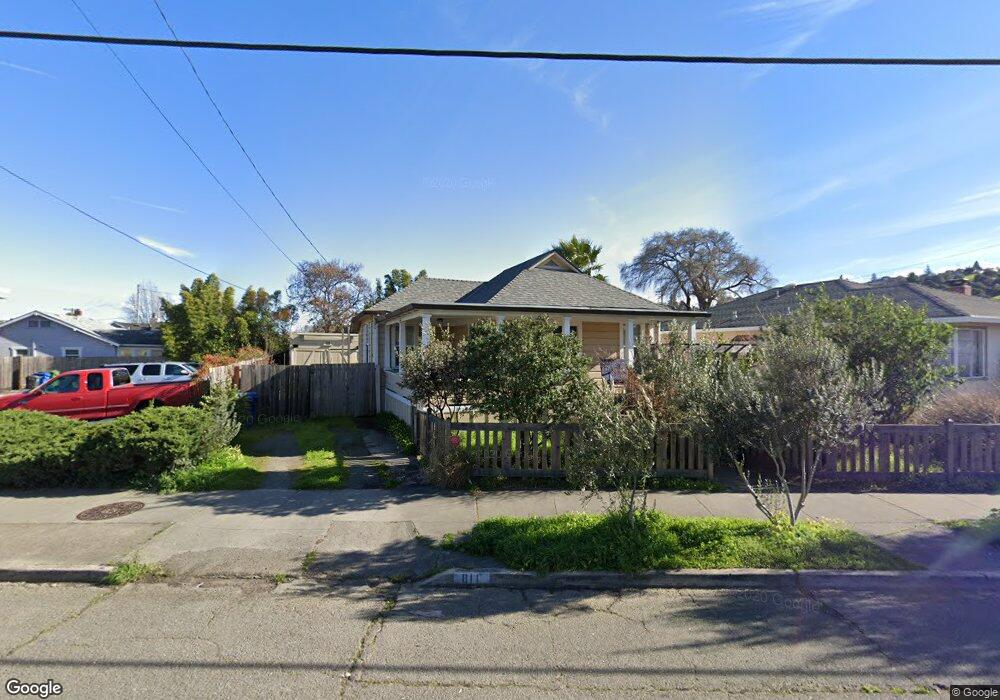
811 Western Ave Petaluma, CA 94952
Western Petaluma NeighborhoodEstimated Value: $851,000 - $930,000
2
Beds
2
Baths
949
Sq Ft
$930/Sq Ft
Est. Value
About This Home
This home is located at 811 Western Ave, Petaluma, CA 94952 and is currently estimated at $882,462, approximately $929 per square foot. 811 Western Ave is a home located in Sonoma County with nearby schools including Valley Vista Elementary School, Petaluma Junior High School, and Petaluma High School.
Ownership History
Date
Name
Owned For
Owner Type
Purchase Details
Closed on
Sep 19, 2014
Sold by
Ingram Matthew S and Mercer Ingram Julie E
Bought by
Latimer Mark
Current Estimated Value
Home Financials for this Owner
Home Financials are based on the most recent Mortgage that was taken out on this home.
Original Mortgage
$530,066
Outstanding Balance
$411,127
Interest Rate
4.5%
Mortgage Type
FHA
Estimated Equity
$471,335
Purchase Details
Closed on
May 11, 2012
Sold by
Moreda Donald J
Bought by
Ingram Matthew S and Mercer Ingram Julie E
Home Financials for this Owner
Home Financials are based on the most recent Mortgage that was taken out on this home.
Original Mortgage
$347,700
Interest Rate
3.98%
Mortgage Type
New Conventional
Purchase Details
Closed on
Jul 22, 2011
Sold by
Moreda Deborah Lyn
Bought by
Moreda Donald J
Home Financials for this Owner
Home Financials are based on the most recent Mortgage that was taken out on this home.
Original Mortgage
$159,000
Interest Rate
4.46%
Mortgage Type
Purchase Money Mortgage
Purchase Details
Closed on
Jul 20, 2011
Sold by
U S Bank National Association
Bought by
Moreda Donald J
Home Financials for this Owner
Home Financials are based on the most recent Mortgage that was taken out on this home.
Original Mortgage
$159,000
Interest Rate
4.46%
Mortgage Type
Purchase Money Mortgage
Purchase Details
Closed on
Apr 29, 2011
Sold by
Malilay Aaron
Bought by
U S Bank National Association and Federal Deposit Insurance Corporation
Purchase Details
Closed on
Mar 17, 2005
Sold by
Malilay Tina
Bought by
Malilay Aaron
Home Financials for this Owner
Home Financials are based on the most recent Mortgage that was taken out on this home.
Original Mortgage
$409,600
Interest Rate
6.38%
Mortgage Type
Purchase Money Mortgage
Purchase Details
Closed on
Jun 3, 1994
Sold by
Grob Joe and Grob Jean
Bought by
Grob Joe and Grob Jean
Create a Home Valuation Report for This Property
The Home Valuation Report is an in-depth analysis detailing your home's value as well as a comparison with similar homes in the area
Home Values in the Area
Average Home Value in this Area
Purchase History
| Date | Buyer | Sale Price | Title Company |
|---|---|---|---|
| Latimer Mark | $545,000 | First American Title Company | |
| Ingram Matthew S | $366,000 | First American Title Company | |
| Moreda Donald J | -- | Lawyers Title Company | |
| Moreda Donald J | $227,500 | Lawyers Title Company | |
| U S Bank National Association | $239,250 | Lawyers Title | |
| Malilay Aaron | -- | Fidelity National Title Co | |
| Malilay Aaron | $423,000 | Fidelity National Title Co | |
| Grob Joe | -- | -- | |
| Grob Joe | -- | -- |
Source: Public Records
Mortgage History
| Date | Status | Borrower | Loan Amount |
|---|---|---|---|
| Open | Latimer Mark | $530,066 | |
| Previous Owner | Ingram Matthew S | $347,700 | |
| Previous Owner | Moreda Donald J | $159,000 | |
| Previous Owner | Malilay Aaron | $409,600 |
Source: Public Records
Tax History
| Year | Tax Paid | Tax Assessment Tax Assessment Total Assessment is a certain percentage of the fair market value that is determined by local assessors to be the total taxable value of land and additions on the property. | Land | Improvement |
|---|---|---|---|---|
| 2025 | $7,115 | $654,996 | $261,998 | $392,998 |
| 2024 | $7,115 | $642,154 | $256,861 | $385,293 |
| 2023 | $7,115 | $629,564 | $251,825 | $377,739 |
| 2022 | $6,886 | $617,221 | $246,888 | $370,333 |
| 2021 | $6,757 | $605,120 | $242,048 | $363,072 |
| 2020 | $6,815 | $598,917 | $239,567 | $359,350 |
| 2019 | $6,731 | $587,174 | $234,870 | $352,304 |
| 2018 | $6,706 | $575,662 | $230,265 | $345,397 |
| 2017 | $6,566 | $564,375 | $225,750 | $338,625 |
| 2016 | $6,412 | $553,310 | $221,324 | $331,986 |
| 2015 | $6,323 | $545,000 | $218,000 | $327,000 |
| 2014 | $4,377 | $375,014 | $150,108 | $224,906 |
Source: Public Records
Map
Nearby Homes
Your Personal Tour Guide
Ask me questions while you tour the home.