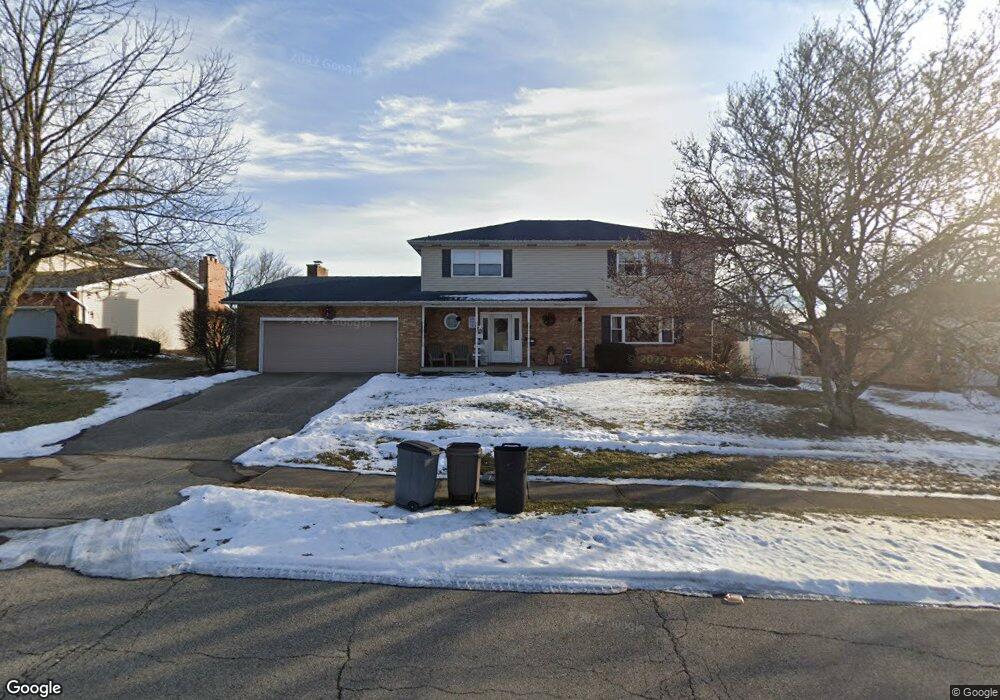
811 Weybridge Dr Springfield, OH 45503
Estimated Value: $322,190 - $351,000
4
Beds
3
Baths
3,491
Sq Ft
$96/Sq Ft
Est. Value
About This Home
This home is located at 811 Weybridge Dr, Springfield, OH 45503 and is currently estimated at $336,548, approximately $96 per square foot. 811 Weybridge Dr is a home located in Clark County with nearby schools including Kenton Elementary School, Roosevelt Middle School, and Springfield High School.
Ownership History
Date
Name
Owned For
Owner Type
Purchase Details
Closed on
Apr 29, 2021
Sold by
Emmons Justin T
Bought by
Emmons Justin T and Emmons Jennifer L
Current Estimated Value
Home Financials for this Owner
Home Financials are based on the most recent Mortgage that was taken out on this home.
Original Mortgage
$132,424
Outstanding Balance
$98,266
Interest Rate
3.1%
Mortgage Type
New Conventional
Estimated Equity
$238,282
Purchase Details
Closed on
Nov 5, 2015
Sold by
Deer David E and Deer Susan G
Bought by
Emmons Justin T
Home Financials for this Owner
Home Financials are based on the most recent Mortgage that was taken out on this home.
Original Mortgage
$137,108
Interest Rate
3.87%
Mortgage Type
FHA
Purchase Details
Closed on
Nov 12, 2002
Sold by
Oakman Mark W and Oakman Ginger L
Bought by
Deer David E and Deer Susan G
Home Financials for this Owner
Home Financials are based on the most recent Mortgage that was taken out on this home.
Original Mortgage
$169,215
Interest Rate
6.1%
Mortgage Type
Purchase Money Mortgage
Purchase Details
Closed on
Jul 30, 1993
Create a Home Valuation Report for This Property
The Home Valuation Report is an in-depth analysis detailing your home's value as well as a comparison with similar homes in the area
Home Values in the Area
Average Home Value in this Area
Purchase History
| Date | Buyer | Sale Price | Title Company |
|---|---|---|---|
| Emmons Justin T | -- | Hallmark Title | |
| Emmons Justin T | $140,000 | Attorney | |
| Deer David E | $170,000 | -- | |
| -- | $164,500 | -- |
Source: Public Records
Mortgage History
| Date | Status | Borrower | Loan Amount |
|---|---|---|---|
| Open | Emmons Justin T | $132,424 | |
| Closed | Emmons Justin T | $137,108 | |
| Previous Owner | Deer David E | $169,215 |
Source: Public Records
Tax History
| Year | Tax Paid | Tax Assessment Tax Assessment Total Assessment is a certain percentage of the fair market value that is determined by local assessors to be the total taxable value of land and additions on the property. | Land | Improvement |
|---|---|---|---|---|
| 2025 | $3,914 | $101,410 | $15,840 | $85,570 |
| 2024 | $3,812 | $79,110 | $13,910 | $65,200 |
| 2023 | $3,812 | $79,110 | $13,910 | $65,200 |
| 2022 | $3,905 | $79,110 | $13,910 | $65,200 |
| 2021 | $3,056 | $57,160 | $11,310 | $45,850 |
| 2020 | $3,063 | $57,160 | $11,310 | $45,850 |
| 2019 | $3,071 | $57,160 | $11,310 | $45,850 |
| 2018 | $3,251 | $58,130 | $8,910 | $49,220 |
| 2017 | $3,249 | $63,690 | $8,908 | $54,782 |
| 2016 | $3,253 | $63,690 | $8,908 | $54,782 |
| 2015 | $3,024 | $57,442 | $8,484 | $48,958 |
| 2014 | $1,505 | $57,442 | $8,484 | $48,958 |
| 2013 | $2,978 | $57,442 | $8,484 | $48,958 |
Source: Public Records
Map
Nearby Homes
- 2824 Balsam Dr
- 3135 Imperial Blvd
- 3021 Argonne Ln N
- 516 Rensselaer St
- 3124 El Camino Dr
- 3027 Argonne Ln N Unit 3027
- 3153 Argonne Ln N
- 615 Villa Rd Unit K
- 3250 Argonne Ln N
- 3247 Argonne Ln N Unit 3247
- 2951 Archer Ln
- 2553 Derr Rd
- 2540 Rebecca Dr
- 1046 Fruitland Rd
- 366 Northfield Blvd Unit 1C
- 224 Roscommon Dr
- 1032 Armsgate Rd
- 2153 Olympic St Unit 2153
- 1040 Carson Ln
- 1139 Bradford Dr
- 821 Weybridge Dr
- 2920 Wellsford Dr
- 808 Torrence Dr
- 841 Weybridge Dr
- 818 Torrence Dr
- 2910 Wellsford Dr
- 2910 Wellsford Ln
- 810 Weybridge Dr
- 800 Weybridge Dr
- 828 Torrence Dr
- 820 Weybridge Dr
- 2921 Wellsford Dr
- 851 Weybridge Dr
- 750 Weybridge Dr
- 2909 Wellsford Dr
- 2909 Wellsford Ln
- 830 Weybridge Dr
- 938 Torrence Dr
- 2838 Wellsford Dr
- 813 Torrence Dr
Your Personal Tour Guide
Ask me questions while you tour the home.