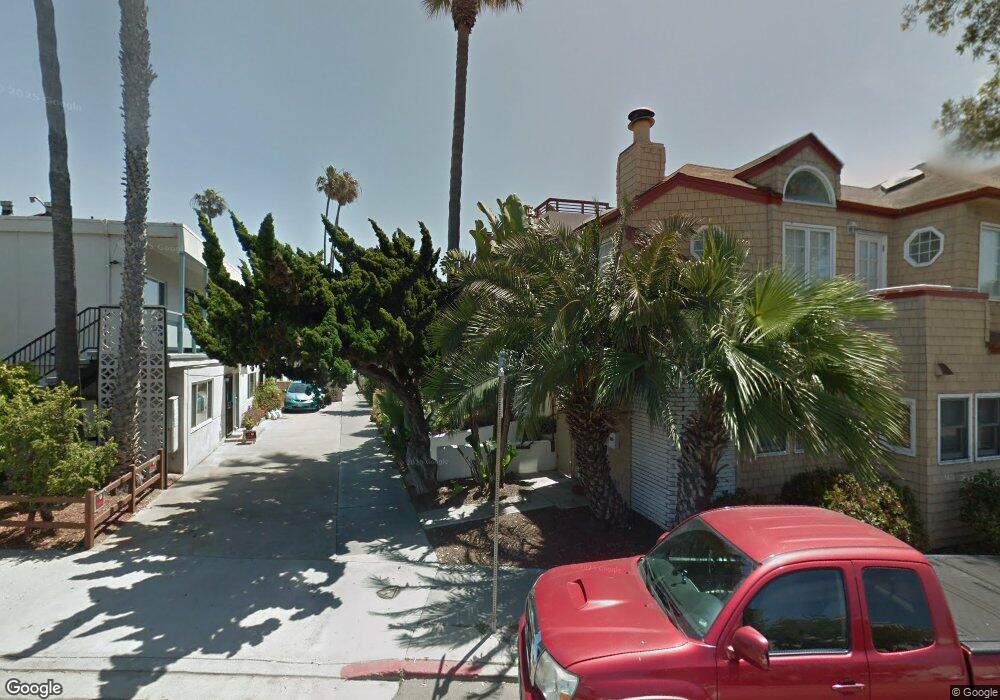
811 Whiting Ct San Diego, CA 92109
Mission Beach NeighborhoodEstimated Value: $1,490,842 - $2,175,000
2
Beds
2
Baths
1,066
Sq Ft
$1,773/Sq Ft
Est. Value
About This Home
This home is located at 811 Whiting Ct, San Diego, CA 92109 and is currently estimated at $1,890,211, approximately $1,773 per square foot. 811 Whiting Ct is a home located in San Diego County with nearby schools including Pacific Beach Elementary School, Pacific Beach Middle, and Mission Bay High School.
Ownership History
Date
Name
Owned For
Owner Type
Purchase Details
Closed on
Dec 13, 2012
Sold by
Engelke Keith Alan
Bought by
Engelke Keith A and Yau Emily H
Current Estimated Value
Purchase Details
Closed on
Feb 17, 2009
Sold by
Engelke Keith A
Bought by
Engelke Keith Alan
Home Financials for this Owner
Home Financials are based on the most recent Mortgage that was taken out on this home.
Original Mortgage
$357,700
Outstanding Balance
$223,924
Interest Rate
4.92%
Mortgage Type
New Conventional
Estimated Equity
$1,666,287
Purchase Details
Closed on
Apr 15, 2001
Sold by
Decaro Angela M and The Decaro Family Trust
Bought by
Engelke Keith A
Home Financials for this Owner
Home Financials are based on the most recent Mortgage that was taken out on this home.
Original Mortgage
$363,200
Interest Rate
6.89%
Purchase Details
Closed on
Nov 30, 1998
Sold by
Decaro James M
Bought by
Decaro James M and Decaro Family Trust
Purchase Details
Closed on
Oct 17, 1985
Create a Home Valuation Report for This Property
The Home Valuation Report is an in-depth analysis detailing your home's value as well as a comparison with similar homes in the area
Home Values in the Area
Average Home Value in this Area
Purchase History
| Date | Buyer | Sale Price | Title Company |
|---|---|---|---|
| Engelke Keith A | -- | None Available | |
| Engelke Keith Alan | -- | Stewart Title Company | |
| Engelke Keith A | $454,500 | Lawyers Title | |
| Decaro James M | -- | -- | |
| -- | $140,000 | -- |
Source: Public Records
Mortgage History
| Date | Status | Borrower | Loan Amount |
|---|---|---|---|
| Open | Engelke Keith Alan | $357,700 | |
| Closed | Engelke Keith A | $363,200 |
Source: Public Records
Tax History Compared to Growth
Tax History
| Year | Tax Paid | Tax Assessment Tax Assessment Total Assessment is a certain percentage of the fair market value that is determined by local assessors to be the total taxable value of land and additions on the property. | Land | Improvement |
|---|---|---|---|---|
| 2025 | $8,624 | $711,961 | $426,473 | $285,488 |
| 2024 | $8,624 | $698,002 | $418,111 | $279,891 |
| 2023 | $8,432 | $684,316 | $409,913 | $274,403 |
| 2022 | $8,207 | $670,899 | $401,876 | $269,023 |
| 2021 | $8,150 | $657,746 | $393,997 | $263,749 |
| 2020 | $8,055 | $651,003 | $389,958 | $261,045 |
| 2019 | $7,912 | $638,239 | $382,312 | $255,927 |
| 2018 | $7,398 | $625,725 | $374,816 | $250,909 |
| 2017 | $7,234 | $613,457 | $367,467 | $245,990 |
| 2016 | $7,119 | $601,429 | $360,262 | $241,167 |
| 2015 | $7,015 | $592,396 | $354,851 | $237,545 |
| 2014 | $6,898 | $580,792 | $347,900 | $232,892 |
Source: Public Records
Map
Nearby Homes
- 804 Toulon Ct
- 3921 Ocean Front Walk
- 3958 Mission Blvd
- 3879 Ocean Front Walk
- 701 Sunset Ct
- 713 San Jose Place
- 3756-58 Mission Blvd Unit H,I,J,K,L
- 806 Redondo Ct
- 4111 Bayard St
- 814-16 Pismo Ct
- 830 Pismo Ct
- 821 Portsmouth Ct Unit E
- 3719 Mission Blvd
- 727 Ostend Ct
- 1177 Pacific Beach Dr Unit A
- 1152-54 Pacific Beach Dr
- 1122 Oliver Ave Unit U4
- 4007 Everts St Unit 3G
- 4007 Everts St Unit 4H
- 866 Grand Ave
- 807 Whiting Ct
- 819 Whiting Ct
- 805 Whiting Ct
- 801 Whiting Ct
- 822 Verona Ct
- 3939 Mission Blvd
- 3948 Bayside Walk
- 3936 Bayside Walk
- 806 Verona Ct Unit 14
- 3946 Bayside Walk
- 804 Verona Ct
- 3930 Bayside Walk
- 821 Verona Ct
- 817 Verona Ct
- 3947 Mission Blvd
- 807 Windemere Ct
- 829 Verona Ct
- 811 Verona Ct
- 813 Windemere Ct
- 3950 Bayside Walk