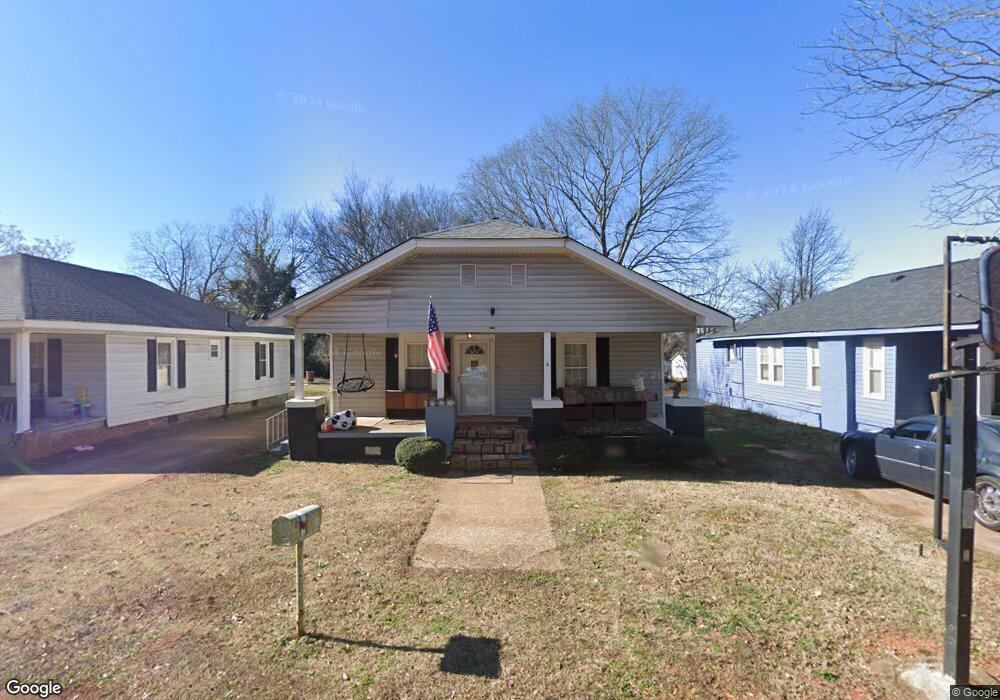
811 Whitlock St Spartanburg, SC 29301
Saxon NeighborhoodEstimated Value: $108,535 - $172,000
2
Beds
1
Bath
1,225
Sq Ft
$110/Sq Ft
Est. Value
About This Home
This home is located at 811 Whitlock St, Spartanburg, SC 29301 and is currently estimated at $135,134, approximately $110 per square foot. 811 Whitlock St is a home located in Spartanburg County with nearby schools including Spartanburg High School, Spartanburg Preparatory School, and First Baptist Weekday Preschool.
Ownership History
Date
Name
Owned For
Owner Type
Purchase Details
Closed on
Feb 2, 2015
Sold by
Mahmud Farrah Bebe
Bought by
Brn Investments Llc
Current Estimated Value
Purchase Details
Closed on
Jun 2, 2014
Sold by
Keylink Real Estate Inc
Bought by
Mahmud Farrah Bebe
Purchase Details
Closed on
Oct 7, 2013
Sold by
Goamerica Llc
Bought by
Keylink Real Estate Inc
Purchase Details
Closed on
Jun 25, 2013
Sold by
The Bank Of New York Mellon
Bought by
Go America Llc
Purchase Details
Closed on
Sep 14, 2012
Sold by
Parker David and Parker Selena D
Bought by
The Bank Of New York Mellon and The Bank Of New York
Purchase Details
Closed on
Jan 15, 2004
Sold by
Glc Enterprises Inc
Bought by
Parker David and Parker Selena D
Purchase Details
Closed on
Mar 11, 2003
Sold by
Fairbanks Capital Corp
Bought by
Glc Enterprises Inc
Purchase Details
Closed on
Feb 27, 2003
Sold by
Davis Mona
Bought by
Fairbanks Capital Corp and Homecomings Financial Network Inc
Create a Home Valuation Report for This Property
The Home Valuation Report is an in-depth analysis detailing your home's value as well as a comparison with similar homes in the area
Home Values in the Area
Average Home Value in this Area
Purchase History
| Date | Buyer | Sale Price | Title Company |
|---|---|---|---|
| Brn Investments Llc | -- | -- | |
| Mahmud Farrah Bebe | $9,000 | -- | |
| Keylink Real Estate Inc | -- | -- | |
| Go America Llc | $9,138 | -- | |
| The Bank Of New York Mellon | $54,244 | -- | |
| Parker David | $51,000 | -- | |
| Glc Enterprises Inc | $23,000 | -- | |
| Fairbanks Capital Corp | $500 | -- |
Source: Public Records
Tax History Compared to Growth
Tax History
| Year | Tax Paid | Tax Assessment Tax Assessment Total Assessment is a certain percentage of the fair market value that is determined by local assessors to be the total taxable value of land and additions on the property. | Land | Improvement |
|---|---|---|---|---|
| 2025 | $749 | $1,635 | $252 | $1,383 |
| 2024 | $749 | $1,635 | $252 | $1,383 |
| 2023 | $749 | $1,635 | $252 | $1,383 |
| 2022 | $651 | $1,422 | $360 | $1,062 |
| 2021 | $650 | $1,422 | $360 | $1,062 |
| 2020 | $640 | $1,422 | $360 | $1,062 |
| 2019 | $640 | $1,422 | $360 | $1,062 |
| 2018 | $640 | $1,422 | $360 | $1,062 |
| 2017 | $989 | $2,256 | $360 | $1,896 |
| 2016 | $989 | $2,256 | $360 | $1,896 |
| 2015 | $958 | $2,256 | $360 | $1,896 |
| 2014 | $947 | $2,256 | $360 | $1,896 |
Source: Public Records
Map
Nearby Homes
- 817 Whitlock St
- 807 Whitlock St
- 803 Whitlock St
- 36 Williams St
- 40 Williams St
- 48 Williams St
- 56 Williams St
- 791 Whitlock St
- 792 Whitlock St
- 830 Whitlock St
- 825 Whitlock St
- 37 Williams St
- 819 Hayne St
- 809 Hayne St
- 834 Whitlock St
- 55 Williams St
- 830 Fairfax St
- 787 Whitlock St
- 825 Hayne St
- 832 Fairfax St