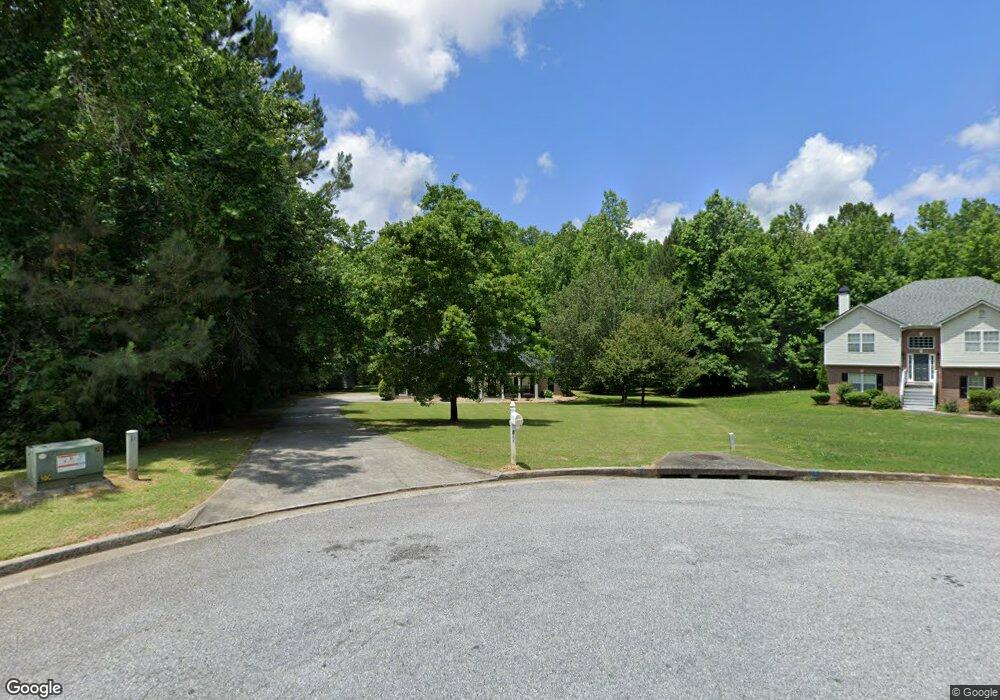
811 Zeiler Ct Hampton, GA 30228
Estimated Value: $300,207 - $356,000
4
Beds
3
Baths
2,116
Sq Ft
$155/Sq Ft
Est. Value
About This Home
This home is located at 811 Zeiler Ct, Hampton, GA 30228 and is currently estimated at $327,802, approximately $154 per square foot. 811 Zeiler Ct is a home located in Clayton County with nearby schools including River's Edge Elementary School, Eddie White Academy, and Lovejoy High School.
Ownership History
Date
Name
Owned For
Owner Type
Purchase Details
Closed on
Jun 22, 2021
Sold by
Cid Housch Joy I
Bought by
Weekly Dove A and Weekly Lesia
Current Estimated Value
Purchase Details
Closed on
Dec 7, 2010
Sold by
Primacy Relocation Llc
Bought by
Cid-Housch Joy I
Home Financials for this Owner
Home Financials are based on the most recent Mortgage that was taken out on this home.
Original Mortgage
$123,731
Interest Rate
4.31%
Mortgage Type
VA
Purchase Details
Closed on
May 27, 2004
Sold by
Steck Kurt W and Steck Tracy M
Bought by
Mooneyhan Samuel A and Mooneyhan Theresa
Home Financials for this Owner
Home Financials are based on the most recent Mortgage that was taken out on this home.
Original Mortgage
$196,000
Interest Rate
6.09%
Mortgage Type
VA
Purchase Details
Closed on
Feb 28, 2001
Sold by
Beta Const Inc
Bought by
Steck Kurt W and Steck Tracy M
Home Financials for this Owner
Home Financials are based on the most recent Mortgage that was taken out on this home.
Original Mortgage
$175,415
Interest Rate
7.01%
Mortgage Type
VA
Create a Home Valuation Report for This Property
The Home Valuation Report is an in-depth analysis detailing your home's value as well as a comparison with similar homes in the area
Home Values in the Area
Average Home Value in this Area
Purchase History
| Date | Buyer | Sale Price | Title Company |
|---|---|---|---|
| Weekly Dove A | -- | -- | |
| Cid-Housch Joy I | $123,800 | -- | |
| Primacy Relocation Llc | $124,000 | -- | |
| Mooneyhan Samuel A | $196,000 | -- | |
| Steck Kurt W | $172,000 | -- |
Source: Public Records
Mortgage History
| Date | Status | Borrower | Loan Amount |
|---|---|---|---|
| Previous Owner | Primacy Relocation Llc | $123,731 | |
| Previous Owner | Mooneyhan Samuel A | $196,000 | |
| Previous Owner | Steck Kurt W | $175,415 |
Source: Public Records
Tax History
| Year | Tax Paid | Tax Assessment Tax Assessment Total Assessment is a certain percentage of the fair market value that is determined by local assessors to be the total taxable value of land and additions on the property. | Land | Improvement |
|---|---|---|---|---|
| 2025 | $4,565 | $128,200 | $10,400 | $117,800 |
| 2024 | $3,674 | $103,200 | $10,400 | $92,800 |
| 2023 | $3,726 | $103,200 | $10,400 | $92,800 |
| 2022 | $3,696 | $103,200 | $10,400 | $92,800 |
| 2021 | $3,236 | $80,960 | $10,400 | $70,560 |
| 2020 | $3,117 | $76,975 | $10,400 | $66,575 |
| 2019 | $3,122 | $75,980 | $10,400 | $65,580 |
| 2018 | $3,011 | $73,240 | $10,400 | $62,840 |
| 2017 | $2,622 | $63,515 | $10,400 | $53,115 |
| 2016 | $2,209 | $53,360 | $10,400 | $42,960 |
| 2015 | $2,025 | $0 | $0 | $0 |
| 2014 | $1,906 | $46,962 | $10,400 | $36,562 |
Source: Public Records
Map
Nearby Homes
- 0 Panhandle Rd Unit LOT 1 10559919
- 0 Panhandle Rd Unit LOT 4 10559933
- 0 Panhandle Rd Unit LOT 3 10559926
- 644 Hampton Rd
- 12328 Edgewater Dr
- 12359 Hillcrest Dr
- 829 Sweden Forest Cove
- 424 Hampton Rd
- 12275 Styron Dr
- 12283 Coldstream Ct
- 12148 Flannery Ln
- 526 Canady Ct
- 12237 Dickson Rd Unit 1
- 1083 Hampton Rd
- 12123 Edgewater Dr
- 12140 Dominion Dr
- 11961 Markham Way
- 12155 Centerra Dr
- 12149 Centerra Dr
- 12090 Centerra Dr
- 807 Zeiler Ct
- 815 Zeiler Ct Unit 3B
- 12674 Panhandle Rd
- 819 Justin Ct
- 12686 Panhandle Rd
- 825 Justin Ct
- 823 Zeiler Ct
- 12660 Panhandle Rd
- 12673 Simmons Rd Unit 27
- 12673 Simmons Rd
- 12698 Panhandle Rd
- 820 Justin Ct
- 12697 Simmons Rd
- 12661 Simmons Rd
- 12644 Panhandle Rd
- 12708 Panhandle Rd
- 12649 Simmons Rd
- 828 Justin Ct
- 721 Lake Cove Dr
- 12632 Panhandle Rd
Your Personal Tour Guide
Ask me questions while you tour the home.