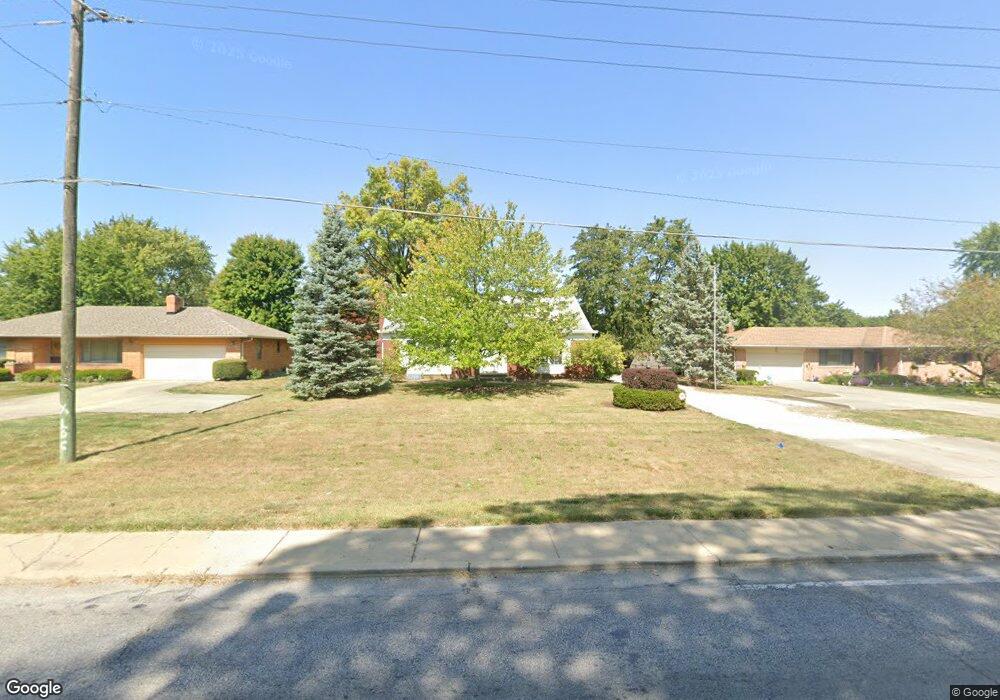
8110 E 10th St Indianapolis, IN 46219
East Warren NeighborhoodEstimated Value: $218,000 - $276,000
3
Beds
1
Bath
2,868
Sq Ft
$88/Sq Ft
Est. Value
About This Home
This home is located at 8110 E 10th St, Indianapolis, IN 46219 and is currently estimated at $252,284, approximately $87 per square foot. 8110 E 10th St is a home located in Marion County with nearby schools including Hawthorne Elementary School, Raymond Park Intermediate School (5-6), and Raymond Park Middle School.
Ownership History
Date
Name
Owned For
Owner Type
Purchase Details
Closed on
Nov 2, 2018
Sold by
Dennis Lee Barker
Bought by
Clevenger Michael and Clevenger Sarah
Current Estimated Value
Home Financials for this Owner
Home Financials are based on the most recent Mortgage that was taken out on this home.
Original Mortgage
$155,700
Outstanding Balance
$136,990
Interest Rate
4.83%
Estimated Equity
$115,294
Purchase Details
Closed on
Sep 14, 2018
Sold by
Barker Dell Byron
Bought by
Barker Dennis Lee
Home Financials for this Owner
Home Financials are based on the most recent Mortgage that was taken out on this home.
Original Mortgage
$155,700
Outstanding Balance
$136,990
Interest Rate
4.83%
Estimated Equity
$115,294
Create a Home Valuation Report for This Property
The Home Valuation Report is an in-depth analysis detailing your home's value as well as a comparison with similar homes in the area
Home Values in the Area
Average Home Value in this Area
Purchase History
| Date | Buyer | Sale Price | Title Company |
|---|---|---|---|
| Clevenger Michael | -- | -- | |
| Barker Dennis Lee | -- | None Available |
Source: Public Records
Mortgage History
| Date | Status | Borrower | Loan Amount |
|---|---|---|---|
| Open | Clevenger Michael | $155,700 | |
| Closed | Clevenger Michael | -- |
Source: Public Records
Tax History
| Year | Tax Paid | Tax Assessment Tax Assessment Total Assessment is a certain percentage of the fair market value that is determined by local assessors to be the total taxable value of land and additions on the property. | Land | Improvement |
|---|---|---|---|---|
| 2024 | $2,849 | $213,300 | $21,200 | $192,100 |
| 2023 | $2,849 | $235,000 | $21,200 | $213,800 |
| 2022 | $2,253 | $190,500 | $21,200 | $169,300 |
| 2021 | $2,088 | $175,900 | $21,200 | $154,700 |
| 2020 | $1,894 | $159,000 | $21,200 | $137,800 |
| 2019 | $1,808 | $151,700 | $21,200 | $130,500 |
| 2018 | $1,653 | $138,400 | $21,200 | $117,200 |
| 2017 | $2,825 | $134,400 | $21,200 | $113,200 |
| 2016 | $2,679 | $127,300 | $21,200 | $106,100 |
| 2014 | $2,288 | $114,400 | $21,200 | $93,200 |
| 2013 | $2,312 | $115,600 | $21,200 | $94,400 |
Source: Public Records
Map
Nearby Homes
- 945 Cecil Ave
- 8230 E 11th St
- 920 N Franklin Rd
- 8240 E 12th St
- 8115 E 13th St
- 934 N Eaton Ave
- 1135 Carroll White Dr
- 1302 N Franklin Rd
- 8040 Goldenrod Ct
- 7820 E Michigan St
- 7831 E Vermont St
- 711 N Fenton Ave
- 1503 Cecil Ave
- 8530 E Michigan St
- 417 N Fenton Ave
- 55 N Devon Ave
- 1516 Wellington Ave
- 306 N Gibson Ave
- 516 Payton Ave
- 8128 Forsythia Ct
Your Personal Tour Guide
Ask me questions while you tour the home.