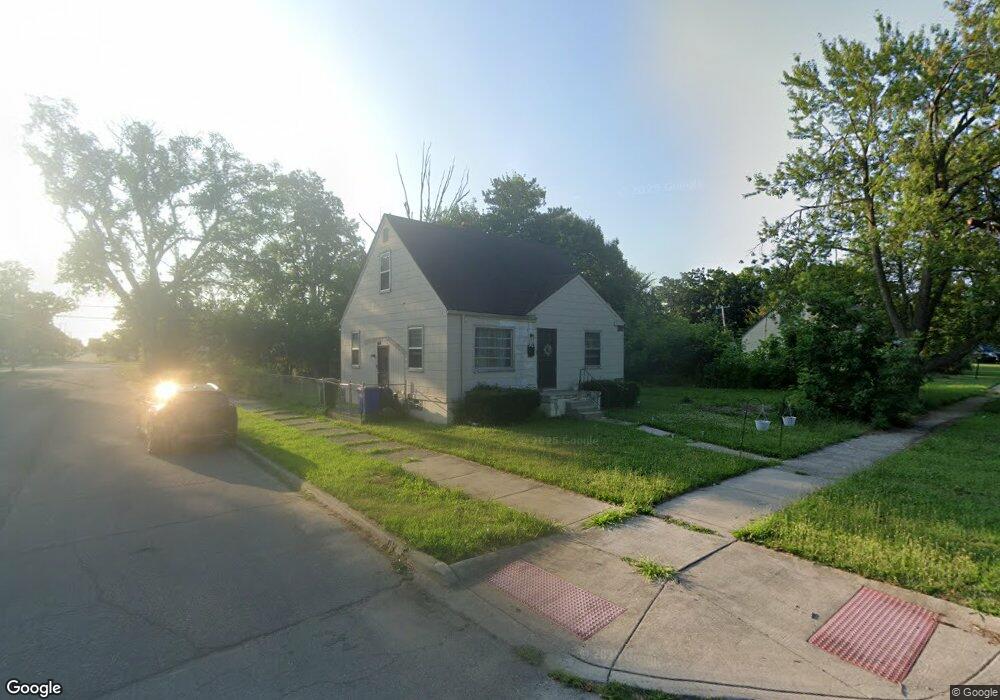
8112 Vaughan St Detroit, MI 48228
Franklin Park NeighborhoodEstimated Value: $64,400 - $80,000
3
Beds
1
Bath
717
Sq Ft
$100/Sq Ft
Est. Value
About This Home
This home is located at 8112 Vaughan St, Detroit, MI 48228 and is currently estimated at $71,850, approximately $100 per square foot. 8112 Vaughan St is a home located in Wayne County with nearby schools including Bates Academy, Charles L. Spain Elementary-Middle School, and Edward 'Duke' Ellington Conservatory of Music and Art.
Ownership History
Date
Name
Owned For
Owner Type
Purchase Details
Closed on
Dec 20, 2016
Sold by
Coleective Tricycle
Bought by
Powell Eric L
Current Estimated Value
Purchase Details
Closed on
May 6, 2014
Sold by
Mcqueen Jacqueline
Bought by
Mcqueen Jacqueline and Gates Milton D
Purchase Details
Closed on
Apr 21, 2014
Sold by
Gates Milton D
Bought by
Mcqueen Jacqueline
Purchase Details
Closed on
Aug 1, 2011
Sold by
Mcqueen Jacqueline
Bought by
Mcqueen Jacqueline and Gates Milton
Purchase Details
Closed on
Jun 7, 2011
Sold by
Secretary Of Housing & Urban Development
Bought by
Mcqueen Jacqueline
Purchase Details
Closed on
Dec 28, 2010
Sold by
Everhome Mortgage Company
Bought by
Secretary Of Housing & Urban Development
Purchase Details
Closed on
Jun 9, 2010
Sold by
Thompson Kimberly and Brown Curtis T
Bought by
Everhome Mortgage Company
Create a Home Valuation Report for This Property
The Home Valuation Report is an in-depth analysis detailing your home's value as well as a comparison with similar homes in the area
Home Values in the Area
Average Home Value in this Area
Purchase History
| Date | Buyer | Sale Price | Title Company |
|---|---|---|---|
| Powell Eric L | -- | None Available | |
| Mcqueen Jacqueline | -- | None Available | |
| Mcqueen Jacqueline | -- | None Available | |
| Mcqueen Jacqueline | -- | None Available | |
| Mcqueen Jacqueline | $2,750 | None Available | |
| Secretary Of Housing & Urban Development | -- | None Available | |
| Everhome Mortgage Company | $63,447 | None Available |
Source: Public Records
Tax History Compared to Growth
Tax History
| Year | Tax Paid | Tax Assessment Tax Assessment Total Assessment is a certain percentage of the fair market value that is determined by local assessors to be the total taxable value of land and additions on the property. | Land | Improvement |
|---|---|---|---|---|
| 2025 | $956 | $30,400 | $0 | $0 |
| 2024 | $956 | $25,400 | $0 | $0 |
| 2023 | $926 | $19,900 | $0 | $0 |
| 2022 | $1,007 | $17,300 | $0 | $0 |
| 2021 | $984 | $13,800 | $0 | $0 |
| 2020 | $974 | $12,300 | $0 | $0 |
| 2019 | $960 | $10,700 | $0 | $0 |
| 2018 | $828 | $10,000 | $0 | $0 |
| 2017 | $193 | $10,200 | $0 | $0 |
| 2016 | $1,201 | $11,400 | $0 | $0 |
| 2015 | $1,140 | $11,400 | $0 | $0 |
| 2013 | $1,713 | $17,126 | $0 | $0 |
| 2010 | -- | $25,109 | $914 | $24,195 |
Source: Public Records
Map
Nearby Homes
- 8084 Evergreen Rd
- 8282 Plainview Ave
- 8294 Plainview Ave
- 20221 Tireman St
- 7792 Evergreen Ave
- 8468 Vaughan St
- 8275 Minock St
- 8103 Fielding St
- 7247 Minock St
- 8491 Heyden St
- 8418 Fielding St
- 8090 Minock St
- 8068 Patton St
- 8300 Minock St
- 8600 Heyden St
- 8638 Heyden St
- 7751 Fielding St
- 8610 Auburn St
- 8627 Stout St
- 8620 Fielding St
- 8111 Evergreen Ave
- 8200 Vaughan St
- 8210 Vaughan St
- 8090 Vaughan St
- 8211 Evergreen Ave
- 8103 Evergreen Ave
- 8201 Evergreen Ave
- 8095 Evergreen Ave
- 8078 Vaughan St
- 8218 Vaughan St
- 8087 Evergreen Ave
- 8113 Vaughan St
- 8072 Vaughan St
- 8105 Vaughan St
- 8221 Evergreen Ave
- 8097 Vaughan St
- 8079 Evergreen Ave
- 8201 Vaughan St
- 8091 Vaughan St
- 8234 Vaughan St