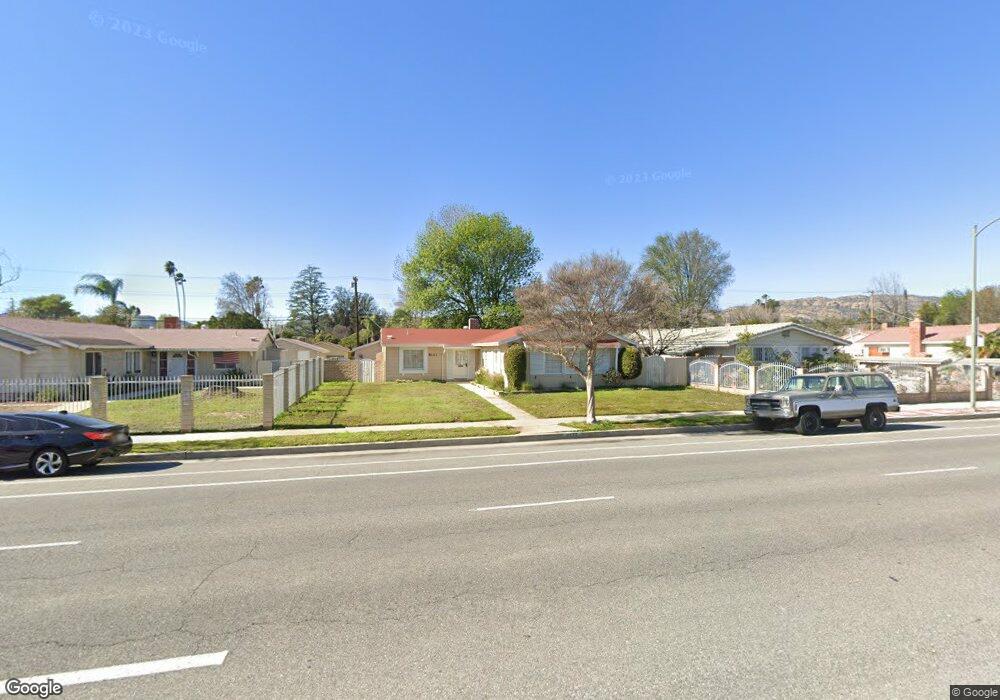
8113 Fallbrook Ave Canoga Park, CA 91304
Canoga Park NeighborhoodEstimated Value: $798,000 - $1,017,000
3
Beds
2
Baths
1,691
Sq Ft
$535/Sq Ft
Est. Value
About This Home
This home is located at 8113 Fallbrook Ave, Canoga Park, CA 91304 and is currently estimated at $904,581, approximately $534 per square foot. 8113 Fallbrook Ave is a home located in Los Angeles County with nearby schools including Capistrano Avenue Elementary School, Christopher Columbus Middle School, and Canoga Park Senior High School.
Ownership History
Date
Name
Owned For
Owner Type
Purchase Details
Closed on
Mar 21, 2024
Sold by
Charles Mond Survivors Trust and Mond Charles
Bought by
Charles And Florence Mond Marital Trust and Mond
Current Estimated Value
Purchase Details
Closed on
Dec 6, 2022
Sold by
Charles And Florence Mond Administrative
Bought by
Charles And Florence Mond Marital Trust
Purchase Details
Closed on
Jul 17, 2020
Sold by
Mond Charles and Mond Charles
Bought by
Mond Charles and The Charles Mond Survivors Tru
Purchase Details
Closed on
Jun 20, 2019
Sold by
Mond Charles and Florence Mond Separate Propert
Bought by
Mond Charles and Mond Charles
Purchase Details
Closed on
Dec 20, 2018
Sold by
Mond Charles and Mond Florence
Bought by
Mond Charles and Mond Florence
Purchase Details
Closed on
May 24, 2010
Sold by
Windsor Exchange Corp
Bought by
Mond Charles and Mond Florence
Purchase Details
Closed on
Feb 23, 2010
Sold by
Scott Joann A
Bought by
Windsor Exchange Corp
Purchase Details
Closed on
Mar 31, 2004
Sold by
Scott Anthony L and Scott Joann A
Bought by
Scott Joann A
Create a Home Valuation Report for This Property
The Home Valuation Report is an in-depth analysis detailing your home's value as well as a comparison with similar homes in the area
Home Values in the Area
Average Home Value in this Area
Purchase History
| Date | Buyer | Sale Price | Title Company |
|---|---|---|---|
| Charles And Florence Mond Marital Trust | -- | None Listed On Document | |
| Charles And Florence Mond Marital Trust | -- | -- | |
| Mond Charles | -- | Stewart Title Company Of Ca | |
| Mond Charles | -- | None Available | |
| Mond Charles | -- | None Available | |
| Mond Charles | -- | Accommodation | |
| Windsor Exchange Corp | $350,000 | None Available | |
| Scott Joann A | -- | -- |
Source: Public Records
Tax History
| Year | Tax Paid | Tax Assessment Tax Assessment Total Assessment is a certain percentage of the fair market value that is determined by local assessors to be the total taxable value of land and additions on the property. | Land | Improvement |
|---|---|---|---|---|
| 2025 | $9,941 | $451,774 | $296,882 | $154,892 |
| 2024 | $9,941 | $795,600 | $561,000 | $234,600 |
| 2023 | $5,604 | $434,232 | $285,354 | $148,878 |
| 2022 | $5,352 | $425,718 | $279,759 | $145,959 |
| 2021 | $5,282 | $417,372 | $274,274 | $143,098 |
| 2019 | $5,129 | $404,994 | $266,140 | $138,854 |
| 2018 | $5,025 | $397,054 | $260,922 | $136,132 |
| 2016 | $4,796 | $381,638 | $250,791 | $130,847 |
| 2015 | $4,728 | $375,906 | $247,024 | $128,882 |
| 2014 | $4,751 | $368,544 | $242,186 | $126,358 |
Source: Public Records
Map
Nearby Homes
- 22906 Lanark St
- 8225 Fallbrook Ave
- 8008 Lena Ave
- 8009 Lena Ave
- 8310 Faust Ave
- 7840 Vicky Ave
- 7746 Mclaren Ave
- 22923 Keswick St
- 7957 Sausalito Ave
- 7722 Faust Ave
- 8380 Kentland Ave
- 8050 Bobbyboyar Ave
- 7663 Sedan Ave
- 7816 Shoup Ave
- 22534 Malden St
- 22537 Saticoy St
- 22824 W Olive Way
- 22323 Schoenborn St
- 22637 Covello St
- 8561 N Walnut Way
- 8119 Fallbrook Ave
- 8112 Mclaren Ave
- 8039 Fallbrook Ave
- 8127 Fallbrook Ave
- 8106 Mclaren Ave
- 8118 Mclaren Ave
- 8040 Mclaren Ave
- 8124 Mclaren Ave
- 8133 Fallbrook Ave
- 8031 Fallbrook Ave
- 8116 Fallbrook Ave
- 8034 Mclaren Ave
- 8122 Fallbrook Ave
- 8130 Mclaren Ave
- 8108 Fallbrook Ave
- 8130 Fallbrook Ave
- 8100 Fallbrook Ave
- 8023 Fallbrook Ave
- 8141 Fallbrook Ave
Your Personal Tour Guide
Ask me questions while you tour the home.