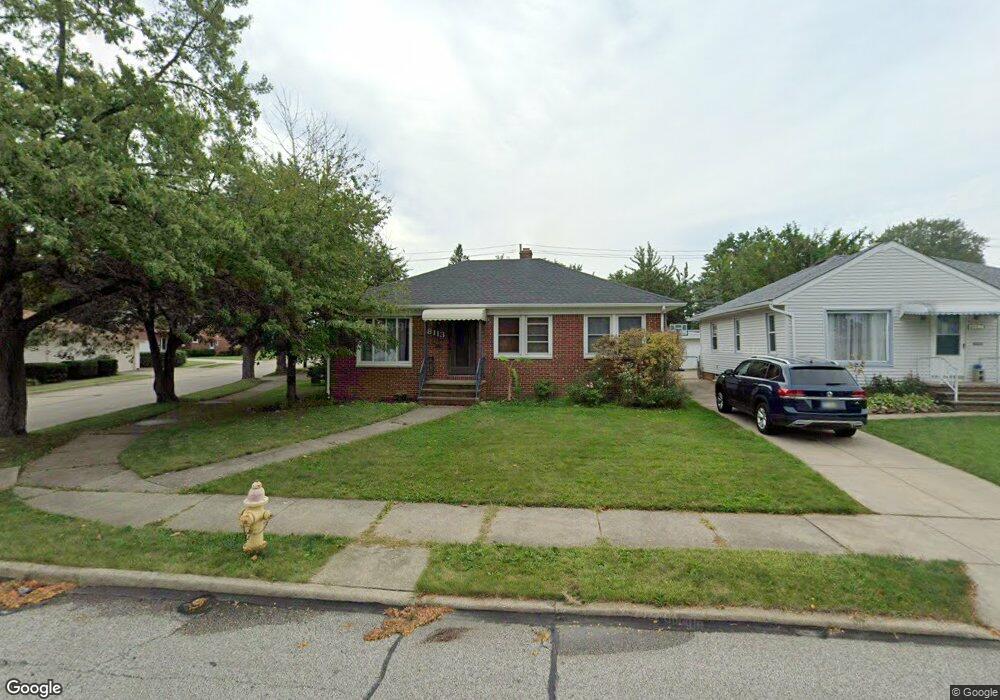
8113 Lanyard Dr Cleveland, OH 44129
Estimated Value: $194,686 - $214,000
3
Beds
1
Bath
1,064
Sq Ft
$194/Sq Ft
Est. Value
About This Home
This home is located at 8113 Lanyard Dr, Cleveland, OH 44129 and is currently estimated at $206,172, approximately $193 per square foot. 8113 Lanyard Dr is a home located in Cuyahoga County with nearby schools including Renwood Elementary School, Thoreau Park Elementary School, and Greenbriar Middle School.
Ownership History
Date
Name
Owned For
Owner Type
Purchase Details
Closed on
Feb 25, 1999
Sold by
Simonyi Louis P
Bought by
Parker Richard P and Parker Tracy A
Current Estimated Value
Home Financials for this Owner
Home Financials are based on the most recent Mortgage that was taken out on this home.
Original Mortgage
$94,500
Outstanding Balance
$23,203
Interest Rate
6.92%
Estimated Equity
$182,969
Purchase Details
Closed on
Oct 19, 1994
Sold by
Szabla Charles T
Bought by
Simonyi Louis P
Home Financials for this Owner
Home Financials are based on the most recent Mortgage that was taken out on this home.
Original Mortgage
$72,000
Interest Rate
8.12%
Mortgage Type
New Conventional
Purchase Details
Closed on
Apr 12, 1985
Sold by
Kocinski Thomas J
Bought by
Szabla Charles T
Purchase Details
Closed on
Jun 8, 1977
Sold by
Fouse Harold and Fouse Mabel
Bought by
Kocinski Thomas J
Purchase Details
Closed on
Jan 1, 1975
Bought by
Fouse Harold and Fouse Mabel
Create a Home Valuation Report for This Property
The Home Valuation Report is an in-depth analysis detailing your home's value as well as a comparison with similar homes in the area
Home Values in the Area
Average Home Value in this Area
Purchase History
| Date | Buyer | Sale Price | Title Company |
|---|---|---|---|
| Parker Richard P | $105,000 | Chicago Title Insurance Comp | |
| Simonyi Louis P | $90,000 | -- | |
| Szabla Charles T | $62,200 | -- | |
| Kocinski Thomas J | $42,000 | -- | |
| Fouse Harold | -- | -- |
Source: Public Records
Mortgage History
| Date | Status | Borrower | Loan Amount |
|---|---|---|---|
| Open | Parker Richard P | $94,500 | |
| Closed | Simonyi Louis P | $72,000 |
Source: Public Records
Tax History Compared to Growth
Tax History
| Year | Tax Paid | Tax Assessment Tax Assessment Total Assessment is a certain percentage of the fair market value that is determined by local assessors to be the total taxable value of land and additions on the property. | Land | Improvement |
|---|---|---|---|---|
| 2024 | $3,487 | $57,085 | $12,495 | $44,590 |
| 2023 | $3,321 | $47,010 | $11,030 | $35,980 |
| 2022 | $3,290 | $47,005 | $11,025 | $35,980 |
| 2021 | $3,385 | $47,010 | $11,030 | $35,980 |
| 2020 | $2,962 | $36,160 | $8,470 | $27,690 |
| 2019 | $2,838 | $103,300 | $24,200 | $79,100 |
| 2018 | $2,723 | $36,160 | $8,470 | $27,690 |
| 2017 | $2,755 | $32,550 | $7,280 | $25,270 |
| 2016 | $2,738 | $32,550 | $7,280 | $25,270 |
| 2015 | $2,632 | $32,550 | $7,280 | $25,270 |
| 2014 | $2,632 | $33,220 | $7,420 | $25,800 |
Source: Public Records
Map
Nearby Homes
- 8514 Deerfield Dr
- 8017 Wainstead Dr
- 8017 Ackley Rd
- 7503 Whittington Dr
- 6136 Ridge Rd
- 5972 Westminster Dr
- 6227 Ridge Rd
- 6168 Manchester Rd
- 6234 N Canterbury Rd
- 5926 Deering Ave
- 6111 Manchester Rd
- 5906 Twin Lakes Dr
- 7514 Spring Garden Rd
- 6298 Chestnut Hills Dr
- 6096 Wareham Dr
- 8314 Oxford Dr
- 7014 Thornton Dr
- 7615 Bertha Ave
- 6439 Keltonshire Rd
- 7115 Hampstead Ave
- 8117 Lanyard Dr
- 8123 Lanyard Dr
- 8103 Lanyard Dr
- 8112 Pelham Dr
- 8116 Pelham Dr
- 8108 Pelham Dr
- 8205 Lanyard Dr
- 8120 Pelham Dr
- 8023 Lanyard Dr
- 8124 Pelham Dr
- 8116 Lanyard Dr
- 8104 Lanyard Dr
- 8120 Lanyard Dr
- 8204 Pelham Dr
- 8209 Lanyard Dr
- 8100 Lanyard Dr
- 8124 Lanyard Dr
- 8017 Lanyard Dr
- 8020 Pelham Dr
- 8208 Pelham Dr