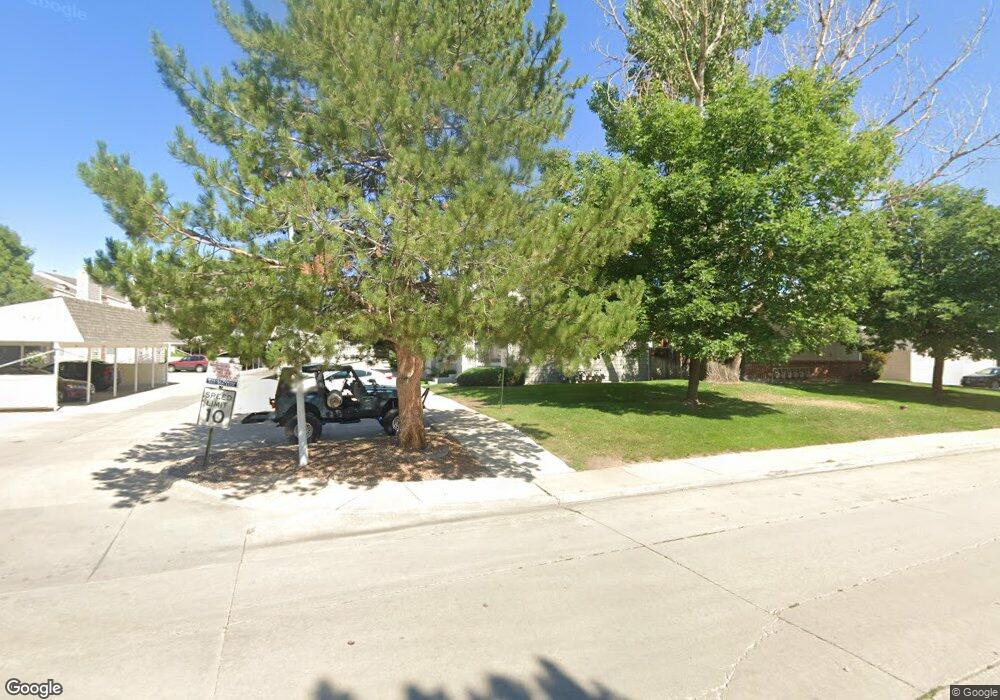
8116 Gray Ct Unit 484 Arvada, CO 80003
Lake Arbor NeighborhoodEstimated Value: $351,000 - $387,852
3
Beds
3
Baths
1,376
Sq Ft
$272/Sq Ft
Est. Value
About This Home
This home is located at 8116 Gray Ct Unit 484, Arvada, CO 80003 and is currently estimated at $373,963, approximately $271 per square foot. 8116 Gray Ct Unit 484 is a home located in Jefferson County with nearby schools including Little Elementary School, Pomona High School, and Face School.
Ownership History
Date
Name
Owned For
Owner Type
Purchase Details
Closed on
Jul 8, 2011
Sold by
Hofstrom Llc
Bought by
Stout Ryan W
Current Estimated Value
Home Financials for this Owner
Home Financials are based on the most recent Mortgage that was taken out on this home.
Original Mortgage
$109,800
Outstanding Balance
$75,575
Interest Rate
4.52%
Mortgage Type
New Conventional
Estimated Equity
$298,388
Purchase Details
Closed on
Feb 28, 2011
Sold by
Fannie Mae
Bought by
Hofstrom Llc
Purchase Details
Closed on
Feb 4, 2011
Sold by
Luevano Louis R
Bought by
Federal National Mortgage Association
Purchase Details
Closed on
Sep 18, 1995
Sold by
Jantz Victor Lee and Jantz Shirley K
Bought by
Luevano Louis R
Home Financials for this Owner
Home Financials are based on the most recent Mortgage that was taken out on this home.
Original Mortgage
$88,945
Interest Rate
7.77%
Mortgage Type
FHA
Create a Home Valuation Report for This Property
The Home Valuation Report is an in-depth analysis detailing your home's value as well as a comparison with similar homes in the area
Home Values in the Area
Average Home Value in this Area
Purchase History
| Date | Buyer | Sale Price | Title Company |
|---|---|---|---|
| Stout Ryan W | $141,000 | Land Title Guarantee Company | |
| Hofstrom Llc | $91,000 | None Available | |
| Federal National Mortgage Association | -- | None Available | |
| Luevano Louis R | $89,900 | Land Title |
Source: Public Records
Mortgage History
| Date | Status | Borrower | Loan Amount |
|---|---|---|---|
| Open | Stout Ryan W | $109,800 | |
| Previous Owner | Luevano Louis R | $88,945 |
Source: Public Records
Tax History
| Year | Tax Paid | Tax Assessment Tax Assessment Total Assessment is a certain percentage of the fair market value that is determined by local assessors to be the total taxable value of land and additions on the property. | Land | Improvement |
|---|---|---|---|---|
| 2024 | $2,132 | $21,984 | $6,030 | $15,954 |
| 2023 | $2,132 | $21,984 | $6,030 | $15,954 |
| 2022 | $1,940 | $19,808 | $4,170 | $15,638 |
| 2021 | $1,972 | $20,378 | $4,290 | $16,088 |
| 2020 | $1,786 | $18,513 | $4,290 | $14,223 |
| 2019 | $1,762 | $18,513 | $4,290 | $14,223 |
| 2018 | $1,566 | $15,996 | $3,600 | $12,396 |
| 2017 | $1,434 | $15,996 | $3,600 | $12,396 |
| 2016 | $1,213 | $12,752 | $2,866 | $9,886 |
| 2015 | $962 | $12,752 | $2,866 | $9,886 |
| 2014 | $962 | $9,504 | $2,229 | $7,275 |
Source: Public Records
Map
Nearby Homes
- 8136 Gray Ct Unit 509
- 5690 W 80th Place Unit 98
- 5690 W 80th Place Unit 91
- 8227 Depew Way
- 5620 W 80th Place Unit 66
- 8250 Chase Way
- 7996 Chase Cir Unit 5
- 7958 Harlan St
- 7936 Eaton St
- 7984 Chase Cir Unit 68
- 7978 Chase Cir Unit B
- 7980 Chase Cir Unit F
- 7977 Chase Cir Unit 47
- 7973 Chase Cir Unit 56
- 7944 Chase Cir Unit 113
- 7917 Chase Cir Unit 160
- 8221 Marshall Ct
- 6161 W 77th Place
- 7936 Marshall Cir
- 8059 Wolff St Unit C
- 8116 Gray Ct Unit 487
- 8116 Gray Ct Unit 486
- 8116 Gray Ct Unit 485
- 8116 Gray Ct Unit 483
- 8116 Gray Ct Unit 482
- 8116 Gray Ct Unit 481
- 8116 Gray Ct
- 8114 Gray Ct Unit 480
- 8114 Gray Ct Unit 479
- 8114 Gray Ct Unit 477
- 8114 Gray Ct Unit 476
- 8116 Gray #484 Ct
- 8104 Gray Ct Unit 383
- 8104 Gray Ct Unit 382
- 8104 Gray Ct Unit 381
- 8104 Gray Ct Unit 380
- 8104 Gray Ct Unit 379
- 8104 Gray Ct
- 8106 Gray Ct Unit 470
- 8106 Gray Ct Unit 469
Your Personal Tour Guide
Ask me questions while you tour the home.