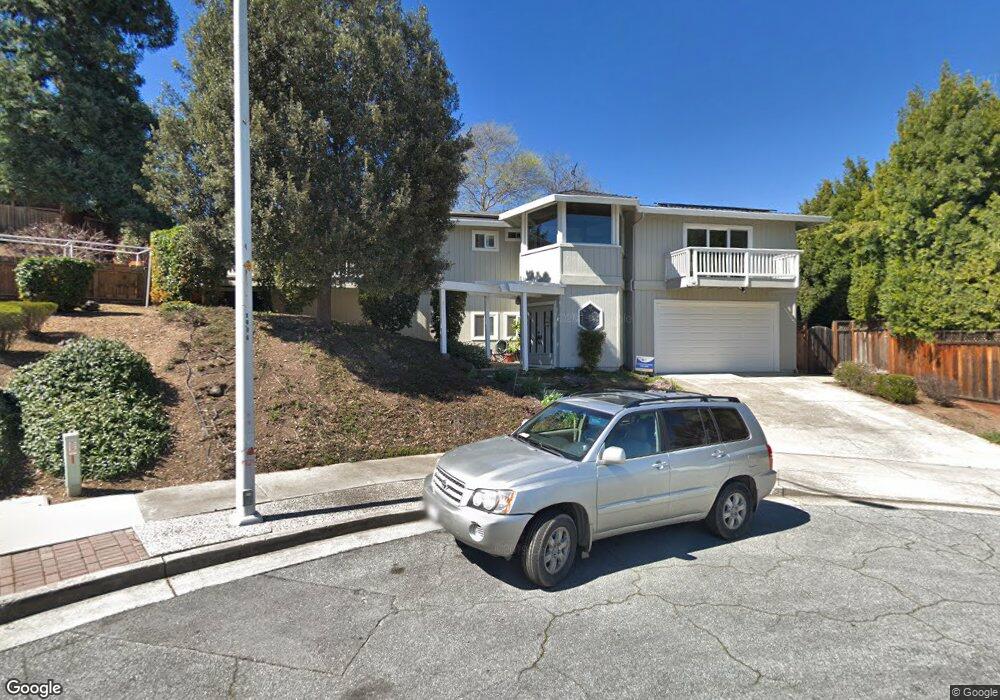
8117 Catalina Ct Gilroy, CA 95020
Las Animas NeighborhoodEstimated Value: $1,039,000 - $1,140,000
4
Beds
2
Baths
2,152
Sq Ft
$508/Sq Ft
Est. Value
About This Home
This home is located at 8117 Catalina Ct, Gilroy, CA 95020 and is currently estimated at $1,093,772, approximately $508 per square foot. 8117 Catalina Ct is a home located in Santa Clara County with nearby schools including Luigi Aprea Elementary School, Brownell Middle School, and Solorsano Middle School.
Ownership History
Date
Name
Owned For
Owner Type
Purchase Details
Closed on
Mar 27, 2020
Sold by
Harrigan Dennis M and Harrigan Renee S
Bought by
Harrigan Dennis M and Harrigan Renee S
Current Estimated Value
Home Financials for this Owner
Home Financials are based on the most recent Mortgage that was taken out on this home.
Original Mortgage
$587,000
Interest Rate
3.1%
Mortgage Type
New Conventional
Purchase Details
Closed on
Jun 3, 2019
Sold by
Harrigan Dennis M and Harrigan Renee
Bought by
The Harrigan Family Trust
Home Financials for this Owner
Home Financials are based on the most recent Mortgage that was taken out on this home.
Original Mortgage
$600,000
Interest Rate
4.2%
Mortgage Type
New Conventional
Purchase Details
Closed on
Jun 9, 2016
Sold by
Harrigan Dennis M and Harrigan Renee S
Bought by
Harrigan Family Trust
Create a Home Valuation Report for This Property
The Home Valuation Report is an in-depth analysis detailing your home's value as well as a comparison with similar homes in the area
Home Values in the Area
Average Home Value in this Area
Purchase History
| Date | Buyer | Sale Price | Title Company |
|---|---|---|---|
| Harrigan Dennis M | -- | Amrock | |
| Harrigan Dennis M | -- | Amrock | |
| The Harrigan Family Trust | -- | Old Republic Title Company | |
| Harrigan Dennis M | -- | Old Republic Title Company | |
| Harrigan Family Trust | -- | None Available | |
| Harrigan Dennis M | -- | None Available |
Source: Public Records
Mortgage History
| Date | Status | Borrower | Loan Amount |
|---|---|---|---|
| Closed | Harrigan Dennis M | $587,000 | |
| Closed | Harrigan Dennis M | $600,000 |
Source: Public Records
Tax History Compared to Growth
Tax History
| Year | Tax Paid | Tax Assessment Tax Assessment Total Assessment is a certain percentage of the fair market value that is determined by local assessors to be the total taxable value of land and additions on the property. | Land | Improvement |
|---|---|---|---|---|
| 2025 | $5,649 | $459,354 | $153,107 | $306,247 |
| 2024 | $5,649 | $450,348 | $150,105 | $300,243 |
| 2023 | $5,615 | $441,518 | $147,162 | $294,356 |
| 2022 | $5,523 | $432,862 | $144,277 | $288,585 |
| 2021 | $5,498 | $424,376 | $141,449 | $282,927 |
| 2020 | $5,437 | $420,025 | $139,999 | $280,026 |
| 2019 | $5,298 | $411,790 | $137,254 | $274,536 |
| 2018 | $4,948 | $403,716 | $134,563 | $269,153 |
| 2017 | $5,049 | $395,801 | $131,925 | $263,876 |
| 2016 | $4,943 | $388,041 | $129,339 | $258,702 |
| 2015 | $4,663 | $382,214 | $127,397 | $254,817 |
| 2014 | $4,633 | $374,728 | $124,902 | $249,826 |
Source: Public Records
Map
Nearby Homes
- 1555 Hecker Pass Rd Unit D201
- 1544 Rosette Way Unit 27
- 8255 Rancho Real
- 7934 Spanish Oak Cir
- 0 California 152
- 1501 Welburn Ave
- 7832 Cobblestone Ct
- 7950 English Oak Cir
- 8320 Chantrelle Ct
- 1297 Chesbro Way
- 8190 Westwood Dr
- 8170 Westwood Dr Unit 22
- 7722 Curry Dr
- 1620 Welburn Ave
- 8341 Winter Green Ct
- 958 Bosco Ln Unit 1603
- 8105 Kern Ave Unit 33
- 1206 Sycamore Ct
- 7611 Westwood Dr
- 1959 Saint Andrews Cir
- 1560 El Dorado Dr
- 8107 Catalina Ct
- 8130 Deville Ct
- 8120 Deville Ct
- 8140 Deville Ct Unit 1
- 8110 Catalina Ct
- 8110 Deville Ct
- 8120 Catalina Ct
- 8157 Delta Dr
- 1567 El Dorado Dr Unit 1
- 1597 El Dorado Dr
- 1557 El Dorado Dr
- 8157 Deville Ct
- 1607 El Dorado Dr
- 1520 El Dorado Dr
- 8167 Delta Dr
- 1617 El Dorado Dr
- 8137 Deville Ct
- 8127 Deville Ct
- 1555 Hecker Pass Rd Unit H202