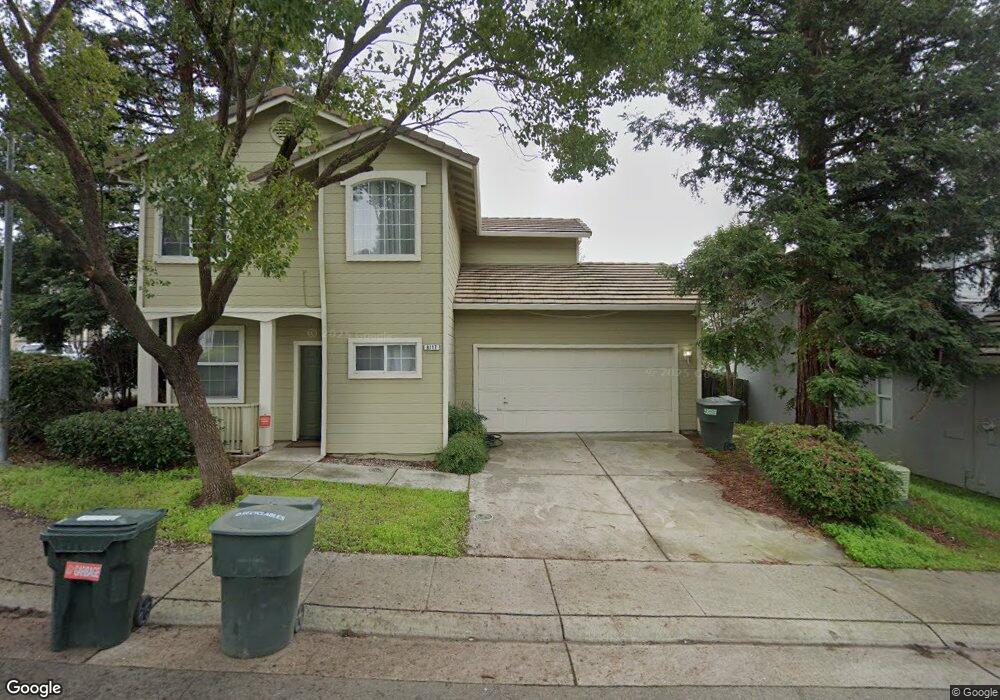
8117 Deer Spring Cir Antelope, CA 95843
Estimated Value: $416,000 - $476,000
3
Beds
2
Baths
1,365
Sq Ft
$328/Sq Ft
Est. Value
About This Home
This home is located at 8117 Deer Spring Cir, Antelope, CA 95843 and is currently estimated at $447,671, approximately $327 per square foot. 8117 Deer Spring Cir is a home located in Sacramento County with nearby schools including Oak Hill Elementary School, Wilson C. Riles Middle School, and Center High School.
Ownership History
Date
Name
Owned For
Owner Type
Purchase Details
Closed on
Jan 20, 2024
Sold by
Chaparro Claudio E and Cunich Maria T
Bought by
Chaparro-Cunich Living Trust and Chaparro
Current Estimated Value
Purchase Details
Closed on
Oct 27, 2008
Sold by
Deutsche Bank National Trust Company
Bought by
Chaparro Claudio E and Cunich Maria T
Purchase Details
Closed on
Feb 8, 2008
Sold by
Perry Benjamin
Bought by
Deutsche Bank National Trust Co and Ameriquest Mortgage Securities Inc
Purchase Details
Closed on
Dec 7, 1994
Sold by
Deer Park Homes Ltd
Bought by
Perry Benjamin
Home Financials for this Owner
Home Financials are based on the most recent Mortgage that was taken out on this home.
Original Mortgage
$125,674
Interest Rate
9.1%
Mortgage Type
Assumption
Create a Home Valuation Report for This Property
The Home Valuation Report is an in-depth analysis detailing your home's value as well as a comparison with similar homes in the area
Home Values in the Area
Average Home Value in this Area
Purchase History
| Date | Buyer | Sale Price | Title Company |
|---|---|---|---|
| Chaparro-Cunich Living Trust | -- | None Listed On Document | |
| Chaparro-Cunich Living Trust | -- | None Listed On Document | |
| Chaparro Claudio E | $190,000 | Stewart Title Of California | |
| Deutsche Bank National Trust Co | $221,689 | Cr Title Services Inc | |
| Perry Benjamin | $123,500 | Stewart Title |
Source: Public Records
Mortgage History
| Date | Status | Borrower | Loan Amount |
|---|---|---|---|
| Previous Owner | Perry Benjamin | $125,674 |
Source: Public Records
Tax History
| Year | Tax Paid | Tax Assessment Tax Assessment Total Assessment is a certain percentage of the fair market value that is determined by local assessors to be the total taxable value of land and additions on the property. | Land | Improvement |
|---|---|---|---|---|
| 2025 | $2,937 | $244,658 | $128,767 | $115,891 |
| 2024 | $2,937 | $239,862 | $126,243 | $113,619 |
| 2023 | $2,874 | $235,160 | $123,768 | $111,392 |
| 2022 | $2,850 | $230,550 | $121,342 | $109,208 |
| 2021 | $2,924 | $226,030 | $118,963 | $107,067 |
| 2020 | $3,148 | $223,714 | $117,744 | $105,970 |
| 2019 | $2,872 | $219,329 | $115,436 | $103,893 |
| 2018 | $2,808 | $215,029 | $113,173 | $101,856 |
| 2017 | $2,725 | $210,813 | $110,954 | $99,859 |
| 2016 | $2,675 | $206,680 | $108,779 | $97,901 |
| 2015 | $2,485 | $203,577 | $107,146 | $96,431 |
| 2014 | $2,537 | $199,591 | $105,048 | $94,543 |
Source: Public Records
Map
Nearby Homes
- 8121 Deer Spring Cir
- 8020 Walerga Rd Unit 3
- 8020 Walerga Rd Unit 1093
- 8233 Dalkeith Way
- 8256 Benjamin Dr
- 4009 Honey Rose Place
- 4246 Albertville Way
- 3941 Grey Livery Way
- 8434 Walerga Rd Unit 327
- 8314 Bramble Bush Cir
- 4115 Copper Hill Ct
- 4632 Swindon Way
- 8304 Oakenshield Cir
- 8625 Valley Rim Way
- 8425 Morning Skye Way
- 4448 Garbo Way
- 4404 Marvel Ct
- 3675 Misty Lake Dr
- 4767 Morgan Oak Ct
- 3812 Blackfoot Way
- 4233 Shandwick Dr
- 8120 Deer Spring Cir
- 8116 Deer Spring Cir
- 8104 Deer Spring Cir
- 8127 Deer Spring Cir
- 4225 Shandwick Dr
- 8100 Deer Spring Cir
- 8124 Deer Spring Cir
- 8112 Deer Spring Cir
- 4232 Shandwick Dr
- 8108 Deer Spring Cir
- 4228 Shandwick Dr
- 8128 Deer Spring Cir
- 8131 Deer Spring Cir
- 4221 Shandwick Dr
- 8337 Deer Spring Cir
- 8333 Deer Spring Cir
- 4224 Shandwick Dr
- 8348 Deer Spring Cir
- 8132 Deer Spring Cir
Your Personal Tour Guide
Ask me questions while you tour the home.