Estimated Value: $215,000 - $371,000
2
Beds
2
Baths
944
Sq Ft
$295/Sq Ft
Est. Value
About This Home
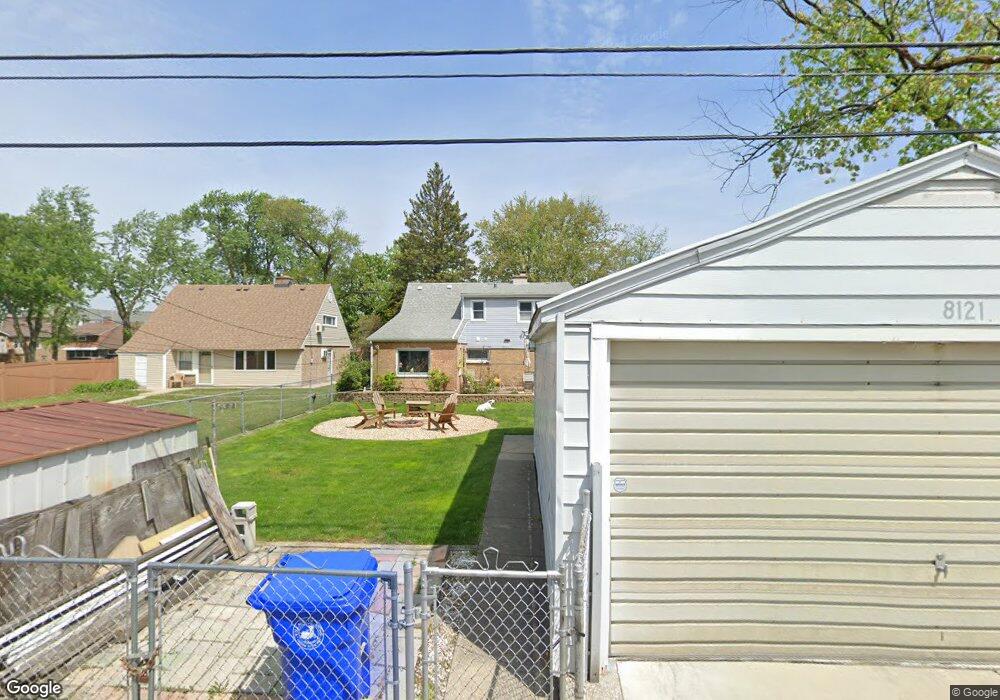
This home is located at 8118 45th St, Lyons, IL 60534 and is currently estimated at $278,699, approximately $295 per square foot. 8118 45th St is a home located in Cook County with nearby schools including Costello Elementary School, George Washington Middle School, and J. Sterling Morton High School West.
Ownership History
Date
Name
Owned For
Owner Type
Purchase Details
Closed on
Sep 6, 2023
Sold by
Tello Guillermina and Tello Elias
Bought by
Tello Guillermina
Current Estimated Value
Purchase Details
Closed on
Feb 3, 2017
Sold by
Carrington Mortgage Services Llc
Bought by
Secretary Of Hud
Purchase Details
Closed on
Nov 1, 2016
Sold by
Kozdron Daniel J
Bought by
Carrington Mortgage Services Llc
Purchase Details
Closed on
Oct 8, 2004
Sold by
Spelina Elizabeth M
Bought by
Kozdron Daniel J
Home Financials for this Owner
Home Financials are based on the most recent Mortgage that was taken out on this home.
Original Mortgage
$157,750
Interest Rate
5.89%
Mortgage Type
FHA
Purchase Details
Closed on
Mar 30, 1994
Sold by
Stemler Calvin P and Stemler Karen A
Bought by
Heintz James P and Spelina Patricia A
Home Financials for this Owner
Home Financials are based on the most recent Mortgage that was taken out on this home.
Original Mortgage
$113,763
Interest Rate
7.51%
Mortgage Type
FHA
Create a Home Valuation Report for This Property
The Home Valuation Report is an in-depth analysis detailing your home's value as well as a comparison with similar homes in the area
Home Values in the Area
Average Home Value in this Area
Purchase History
| Date | Buyer | Sale Price | Title Company |
|---|---|---|---|
| Tello Guillermina | -- | None Listed On Document | |
| Secretary Of Hud | -- | Attorney | |
| Carrington Mortgage Services Llc | -- | Attorney | |
| Kozdron Daniel J | $160,000 | Law Title Insurance | |
| Heintz James P | $76,000 | -- |
Source: Public Records
Mortgage History
| Date | Status | Borrower | Loan Amount |
|---|---|---|---|
| Previous Owner | Kozdron Daniel J | $157,750 | |
| Previous Owner | Heintz James P | $113,763 |
Source: Public Records
Tax History
| Year | Tax Paid | Tax Assessment Tax Assessment Total Assessment is a certain percentage of the fair market value that is determined by local assessors to be the total taxable value of land and additions on the property. | Land | Improvement |
|---|---|---|---|---|
| 2025 | $1,885 | $7,560 | $1,797 | $5,763 |
| 2024 | $1,885 | $7,560 | $1,797 | $5,763 |
| 2023 | $1,891 | $7,560 | $1,797 | $5,763 |
| 2022 | $1,891 | $6,575 | $1,563 | $5,012 |
| 2021 | $1,805 | $6,574 | $1,562 | $5,012 |
| 2020 | $1,845 | $6,574 | $1,562 | $5,012 |
| 2019 | $1,650 | $5,656 | $1,406 | $4,250 |
| 2018 | $1,612 | $5,656 | $1,406 | $4,250 |
| 2017 | $1,922 | $6,655 | $1,406 | $5,249 |
| 2016 | $1,754 | $5,506 | $1,250 | $4,256 |
| 2015 | $1,697 | $5,506 | $1,250 | $4,256 |
| 2014 | $1,646 | $5,506 | $1,250 | $4,256 |
| 2013 | $1,815 | $6,383 | $1,250 | $5,133 |
Source: Public Records
Map
Nearby Homes
- 4448 Lawndale Ave
- 8047 45th Place
- 4448 Joliet Ave
- 8244 44th St
- 8245 43rd Place
- 4539 Clyde Ave
- 4608 Hawthorne Ave
- 8324 44th Place
- 8332 44th Place
- 4617 Joliet Ave
- 7911 45th St
- 4332 Amelia Ave
- 4446 Gage Ave
- 4147 Amelia Ave
- 7731 45th Place
- 4524 1st Ave
- 4350 Elm Ave
- 7700 Joliet Rd
- 4313 Elm Ave
- 4223 Elm Ave
Your Personal Tour Guide
Ask me questions while you tour the home.