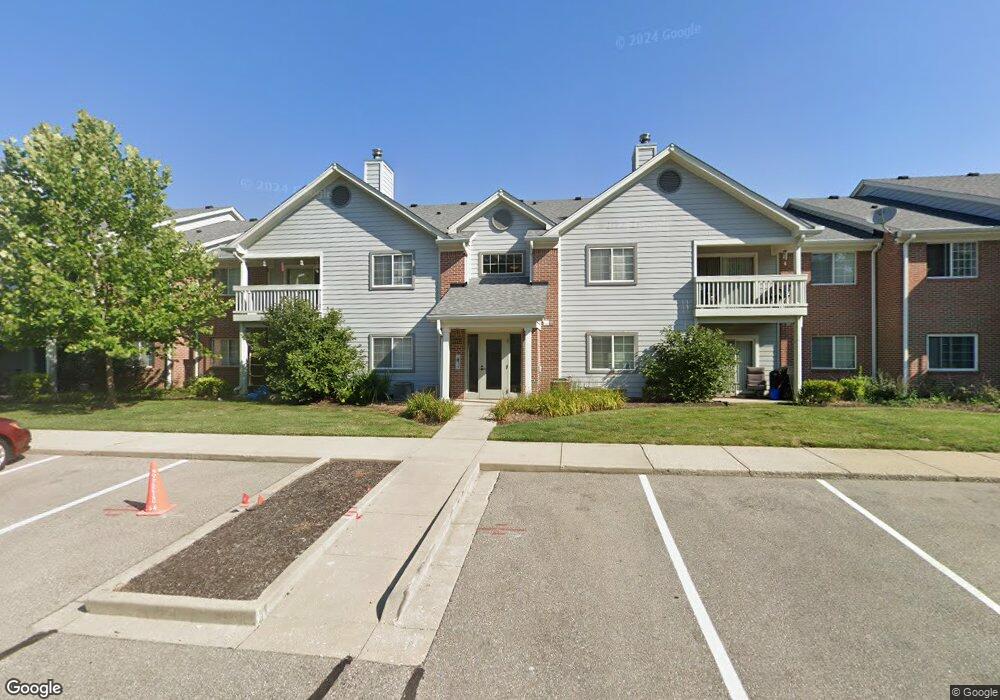
Hidden Creek Condominiums 8118 Brookmont Ct Indianapolis, IN 46278
Traders Point NeighborhoodEstimated Value: $176,000 - $188,000
--
Bed
--
Bath
--
Sq Ft
871
Sq Ft Lot
About This Home
This home is located at 8118 Brookmont Ct, Indianapolis, IN 46278 and is currently estimated at $182,407. 8118 Brookmont Ct is a home located in Marion County with nearby schools including Pike High School and Traders Point Christian Academy.
Ownership History
Date
Name
Owned For
Owner Type
Purchase Details
Closed on
Aug 14, 2019
Sold by
Saha Chandan Kumar
Bought by
Thompson Mitchell A
Current Estimated Value
Home Financials for this Owner
Home Financials are based on the most recent Mortgage that was taken out on this home.
Original Mortgage
$96,715
Outstanding Balance
$86,659
Interest Rate
4.25%
Mortgage Type
FHA
Estimated Equity
$89,068
Purchase Details
Closed on
Feb 14, 2019
Sold by
Bank Of America
Bought by
Saha Chandan Kumar
Purchase Details
Closed on
Dec 27, 2018
Sold by
Bank Of New York Mellon Trust Co
Bought by
Bank Of America
Purchase Details
Closed on
Nov 1, 2018
Sold by
Koerner Mary V
Bought by
Bank Of New York Mellon Trust Co Na
Purchase Details
Closed on
Aug 31, 2018
Sold by
Koerner Mary V
Bought by
Federal National Mortgage Association ("Fanni
Create a Home Valuation Report for This Property
The Home Valuation Report is an in-depth analysis detailing your home's value as well as a comparison with similar homes in the area
Home Values in the Area
Average Home Value in this Area
Purchase History
| Date | Buyer | Sale Price | Title Company |
|---|---|---|---|
| Thompson Mitchell A | $98,500 | Title Services, Llc | |
| Saha Chandan Kumar | $69,258 | None Available | |
| Bank Of America | -- | None Available | |
| Bank Of New York Mellon Trust Co Na | -- | None Available | |
| Federal National Mortgage Association ("Fanni | -- | -- |
Source: Public Records
Mortgage History
| Date | Status | Borrower | Loan Amount |
|---|---|---|---|
| Open | Thompson Mitchell A | $96,715 | |
| Previous Owner | Koerner Mary | $123,000 |
Source: Public Records
Tax History Compared to Growth
Tax History
| Year | Tax Paid | Tax Assessment Tax Assessment Total Assessment is a certain percentage of the fair market value that is determined by local assessors to be the total taxable value of land and additions on the property. | Land | Improvement |
|---|---|---|---|---|
| 2024 | $933 | $129,900 | $18,800 | $111,100 |
| 2023 | $933 | $112,500 | $18,600 | $93,900 |
| 2022 | $963 | $110,700 | $18,500 | $92,200 |
| 2021 | $892 | $101,700 | $17,900 | $83,800 |
| 2020 | $606 | $84,100 | $17,800 | $66,300 |
| 2019 | $438 | $72,400 | $17,600 | $54,800 |
| 2018 | $438 | $71,300 | $17,400 | $53,900 |
| 2017 | $379 | $62,600 | $17,300 | $45,300 |
| 2016 | $372 | $61,400 | $17,300 | $44,100 |
| 2014 | $317 | $59,900 | $17,400 | $42,500 |
| 2013 | $297 | $56,700 | $17,300 | $39,400 |
Source: Public Records
About Hidden Creek Condominiums
Map
Nearby Homes
- 8112 Glenwillow Ln Unit 102
- 8332 Codesa Way
- 8354 Glenwillow Ln Unit 205
- 8927 Cooper Rd
- 8410 Glenwillow Ln Unit 205
- 8751 Lafayette Rd
- 7931 W 86th St
- 9028 Tenton Ct
- 8410 Tuskin Way
- 8316 Thorn Bend Dr
- 9422 Whisper Bend Dr
- 8418 Mesic Ct
- 7818 Fawnwood Dr
- 7722 Shady Hills Dr W
- 9451 Lafayette Rd
- 8816 Waterside Dr
- 8101 Wellsbrook Dr
- 8301 Cooper Ln
- 7527 Sedge Meadow Dr
- 6719 Gunnery Rd
- 8118 Brookmont Ct Unit 207
- 8118 Brookmont Ct Unit 206
- 8118 Brookmont Ct
- 8118 Brookmont Ct
- 8118 Brookmont Ct
- 8118 Brookmont Ct
- 8118 Brookmont Ct
- 8118 Brookmont Ct
- 8118 Brookmont Ct
- 8118 Brookmont Ct Unit 208
- 8118 Brookmont Ct Unit 101
- 8118 Brookmont Ct Unit 104
- 8118 Brookmont Ct Unit 205
- 8118 Brookmont Ct Unit 103
- 8110 Brookmont #207 Ct
- 8118 Brookmont #102 Ct
- 8110 Brookmont Unit 104 Ct Unit 104
- 8134 Brookmont Ct Unit 206
- 8134 Brookmont Ct Unit 104
- 8134 Brookmont Ct