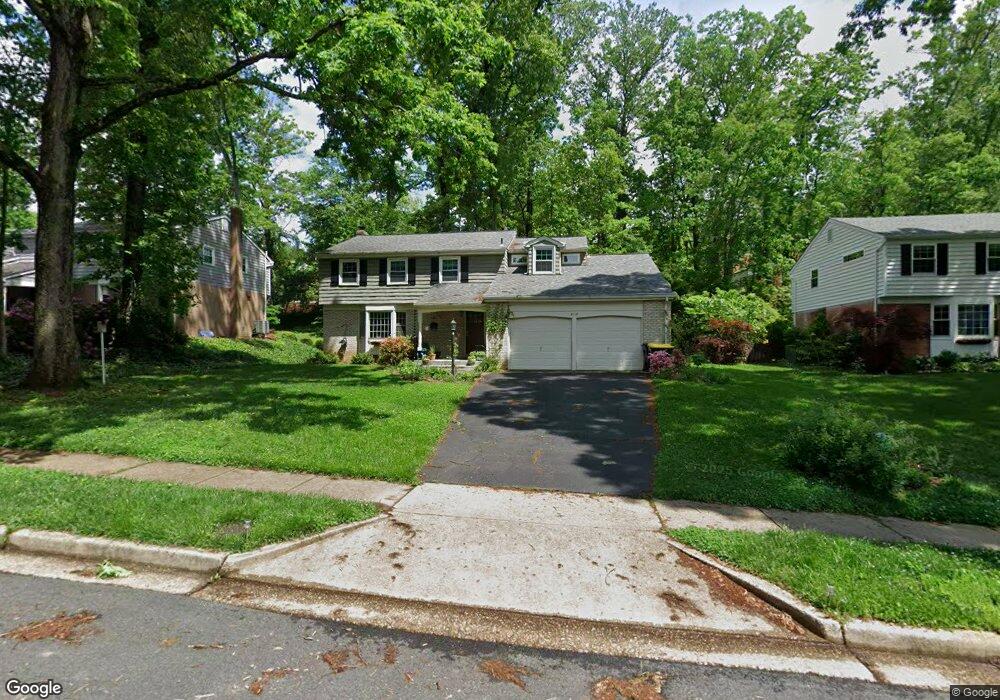
8118 Langbrook Rd Springfield, VA 22152
Estimated Value: $892,000 - $1,013,000
4
Beds
4
Baths
2,542
Sq Ft
$375/Sq Ft
Est. Value
About This Home
This home is located at 8118 Langbrook Rd, Springfield, VA 22152 and is currently estimated at $952,248, approximately $374 per square foot. 8118 Langbrook Rd is a home located in Fairfax County with nearby schools including Cardinal Forest Elementary School, Irving Middle School, and West Springfield High School.
Ownership History
Date
Name
Owned For
Owner Type
Purchase Details
Closed on
Jun 5, 2007
Sold by
Lindsey David A
Bought by
Mccartney Peter and Glass,Margaret
Current Estimated Value
Home Financials for this Owner
Home Financials are based on the most recent Mortgage that was taken out on this home.
Original Mortgage
$417,000
Outstanding Balance
$254,884
Interest Rate
6.17%
Mortgage Type
New Conventional
Estimated Equity
$697,364
Create a Home Valuation Report for This Property
The Home Valuation Report is an in-depth analysis detailing your home's value as well as a comparison with similar homes in the area
Home Values in the Area
Average Home Value in this Area
Purchase History
| Date | Buyer | Sale Price | Title Company |
|---|---|---|---|
| Mccartney Peter | $600,000 | -- |
Source: Public Records
Mortgage History
| Date | Status | Borrower | Loan Amount |
|---|---|---|---|
| Open | Mccartney Peter | $417,000 |
Source: Public Records
Tax History
| Year | Tax Paid | Tax Assessment Tax Assessment Total Assessment is a certain percentage of the fair market value that is determined by local assessors to be the total taxable value of land and additions on the property. | Land | Improvement |
|---|---|---|---|---|
| 2025 | $10,050 | $907,820 | $306,000 | $601,820 |
| 2024 | $10,050 | $867,540 | $286,000 | $581,540 |
| 2023 | $9,193 | $814,660 | $266,000 | $548,660 |
| 2022 | $8,679 | $759,020 | $251,000 | $508,020 |
| 2021 | $7,391 | $629,840 | $211,000 | $418,840 |
| 2020 | $7,346 | $620,690 | $206,000 | $414,690 |
| 2019 | $7,017 | $592,910 | $201,000 | $391,910 |
| 2018 | $6,733 | $585,490 | $201,000 | $384,490 |
| 2017 | $6,642 | $572,060 | $201,000 | $371,060 |
| 2016 | $6,462 | $557,790 | $201,000 | $356,790 |
Source: Public Records
Map
Nearby Homes
- 8141 Kingsway Ct Unit 289
- 5927 Bayshire Rd Unit 115
- 8210 Carrleigh Pkwy Unit 6
- 8222 Carrleigh Pkwy Unit 12
- 5912 Minutemen Rd Unit 295
- 8230 Carrleigh Pkwy Unit 84
- 5913 Prince James Dr Unit J
- 8231K Kings Charter Ln Unit 108
- 8205 Dabney Ave
- 8256 Carrleigh Pkwy
- 6209 Fernleigh Blvd
- 8330 Darlington St Unit 467
- 8312G Kingsgate Rd Unit 532
- 5902-B Queenston St Unit 505
- 8360B Dunham Ct Unit 630
- 8396 Forrester Blvd Unit 555
- 5898G Surrey Hill Place Unit 684
- 7804 Carrleigh Pkwy
- 5845 Rexford Dr Unit 721
- 5824 Rexford Dr Unit 731
- 8116 Langbrook Rd
- 8120 Langbrook Rd
- 8114 Langbrook Rd
- 8122 Langbrook Rd
- 6042 Haverhill Ct
- 6044 Haverhill Ct
- 6040 Haverhill Ct
- 6038 Haverhill Ct
- 8117 Langbrook Rd
- 6036 Haverhill Ct
- 6046 Haverhill Ct
- 6034 Haverhill Ct
- 8121 Langbrook Rd
- 6048 Haverhill Ct
- 6032 Haverhill Ct
- 6050 Haverhill Ct
- 8115 Langbrook Rd
- 6030 Haverhill Ct
- 8112 Langbrook Rd
- 8124 Langbrook Rd
Your Personal Tour Guide
Ask me questions while you tour the home.