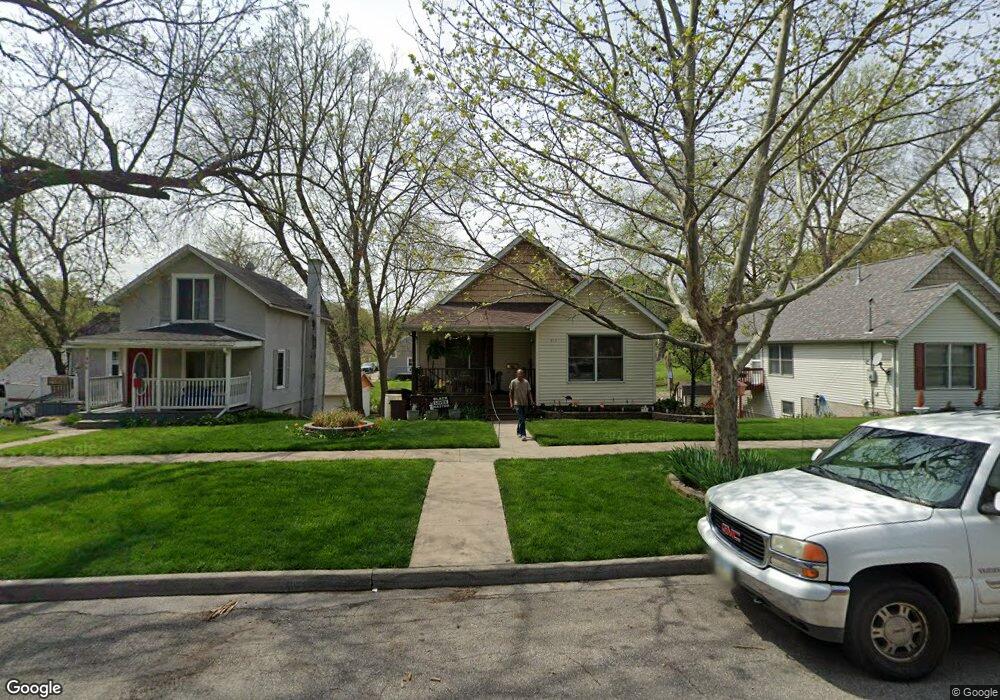
812 24th St Des Moines, IA 50312
Woodland Heights NeighborhoodEstimated Value: $243,000 - $299,000
4
Beds
2
Baths
1,046
Sq Ft
$251/Sq Ft
Est. Value
About This Home
This home is located at 812 24th St, Des Moines, IA 50312 and is currently estimated at $262,391, approximately $250 per square foot. 812 24th St is a home located in Polk County with nearby schools including Greenwood Elementary School and Roosevelt High School.
Ownership History
Date
Name
Owned For
Owner Type
Purchase Details
Closed on
Jan 31, 2002
Sold by
Home Opportunities Made Easy Inc
Bought by
Nichols Maurice E
Current Estimated Value
Purchase Details
Closed on
Oct 20, 1998
Sold by
Allers Ben E
Bought by
Home Opportunities Made Easy Inc
Purchase Details
Closed on
Sep 9, 1998
Sold by
Flood Housing Consortium
Bought by
Allers Ben E
Purchase Details
Closed on
May 8, 1998
Sold by
Flood Housing Consortium
Bought by
Allers Ben E
Create a Home Valuation Report for This Property
The Home Valuation Report is an in-depth analysis detailing your home's value as well as a comparison with similar homes in the area
Home Values in the Area
Average Home Value in this Area
Purchase History
| Date | Buyer | Sale Price | Title Company |
|---|---|---|---|
| Nichols Maurice E | $66,500 | -- | |
| Home Opportunities Made Easy Inc | $1,000 | -- | |
| Allers Ben E | -- | -- | |
| Allers Ben E | -- | -- |
Source: Public Records
Tax History Compared to Growth
Tax History
| Year | Tax Paid | Tax Assessment Tax Assessment Total Assessment is a certain percentage of the fair market value that is determined by local assessors to be the total taxable value of land and additions on the property. | Land | Improvement |
|---|---|---|---|---|
| 2025 | $4,712 | $284,500 | $34,100 | $250,400 |
| 2024 | $4,712 | $257,000 | $30,000 | $227,000 |
| 2023 | $4,516 | $257,000 | $30,000 | $227,000 |
| 2022 | $4,256 | $200,500 | $24,500 | $176,000 |
| 2021 | $4,006 | $200,500 | $24,500 | $176,000 |
| 2020 | $4,156 | $178,700 | $21,800 | $156,900 |
| 2019 | $3,852 | $178,700 | $21,800 | $156,900 |
| 2018 | $3,808 | $161,400 | $19,000 | $142,400 |
| 2017 | $3,682 | $161,400 | $19,000 | $142,400 |
| 2016 | $3,582 | $154,200 | $18,000 | $136,200 |
| 2015 | $3,582 | $154,200 | $18,000 | $136,200 |
| 2014 | $3,320 | $142,100 | $16,300 | $125,800 |
Source: Public Records
Map
Nearby Homes