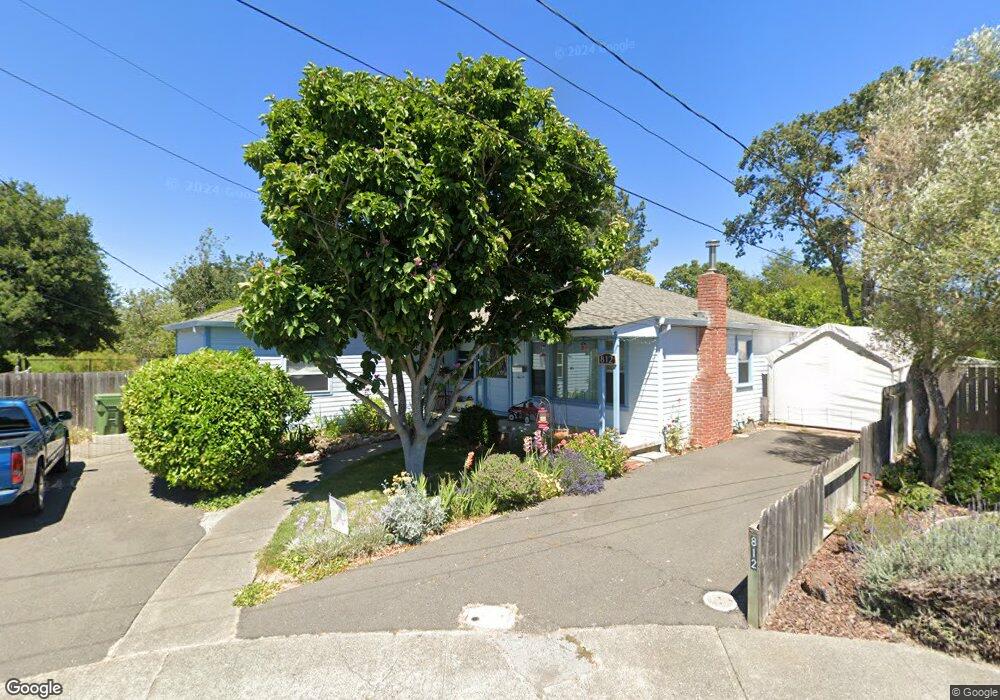
812 Arden Way Petaluma, CA 94952
Estimated Value: $621,842 - $650,000
3
Beds
1
Bath
972
Sq Ft
$654/Sq Ft
Est. Value
About This Home
This home is located at 812 Arden Way, Petaluma, CA 94952 and is currently estimated at $635,711, approximately $654 per square foot. 812 Arden Way is a home located in Sonoma County with nearby schools including McKinley Elementary School, Petaluma Junior High School, and Petaluma High School.
Ownership History
Date
Name
Owned For
Owner Type
Purchase Details
Closed on
Jun 4, 2019
Sold by
Breeden Albert M and Breeden Patricia L
Bought by
Breeden Family Revocable Living Trust
Current Estimated Value
Purchase Details
Closed on
Jan 30, 2001
Sold by
Breeden Albert M & Patricia L Tr
Bought by
Breeden Albert M and Breeden Patricia L
Home Financials for this Owner
Home Financials are based on the most recent Mortgage that was taken out on this home.
Original Mortgage
$198,750
Interest Rate
7.13%
Purchase Details
Closed on
Jul 14, 1995
Sold by
Breeden Albert M and Breeden Patricia L
Bought by
Breeden Albert M and Breeden Patricia L
Purchase Details
Closed on
Feb 24, 1995
Sold by
Breeden Albert M and Breeden Patricia L
Bought by
Breeden Albert M and Breeden Patricia L
Purchase Details
Closed on
Jan 10, 1995
Sold by
Breeden Patricia L and Dagne Brady Trust
Bought by
Breeden Patricia L and Woelbing Norma J
Create a Home Valuation Report for This Property
The Home Valuation Report is an in-depth analysis detailing your home's value as well as a comparison with similar homes in the area
Home Values in the Area
Average Home Value in this Area
Purchase History
| Date | Buyer | Sale Price | Title Company |
|---|---|---|---|
| Breeden Family Revocable Living Trust | -- | None Available | |
| Breeden Albert M | -- | First American Title Co | |
| Breeden Albert M | -- | Northwestern Title Company | |
| Breeden Albert M | -- | -- | |
| Breeden Albert M | -- | -- | |
| Breeden Patricia L | -- | Northwestern Title |
Source: Public Records
Mortgage History
| Date | Status | Borrower | Loan Amount |
|---|---|---|---|
| Closed | Breeden Albert M | $198,750 |
Source: Public Records
Tax History Compared to Growth
Tax History
| Year | Tax Paid | Tax Assessment Tax Assessment Total Assessment is a certain percentage of the fair market value that is determined by local assessors to be the total taxable value of land and additions on the property. | Land | Improvement |
|---|---|---|---|---|
| 2025 | $626 | $44,083 | $15,178 | $28,905 |
| 2024 | $626 | $43,220 | $14,881 | $28,339 |
| 2023 | $626 | $42,374 | $14,590 | $27,784 |
| 2022 | $401 | $41,544 | $14,304 | $27,240 |
| 2021 | $392 | $40,730 | $14,024 | $26,706 |
| 2020 | $395 | $40,314 | $13,881 | $26,433 |
| 2019 | $389 | $39,524 | $13,609 | $25,915 |
| 2018 | $386 | $38,750 | $13,343 | $25,407 |
| 2017 | $376 | $37,991 | $13,082 | $24,909 |
| 2016 | $355 | $37,247 | $12,826 | $24,421 |
| 2015 | $349 | $36,689 | $12,634 | $24,055 |
| 2014 | $346 | $35,971 | $12,387 | $23,584 |
Source: Public Records
Map
Nearby Homes
- 837 Madison St
- 55 Burlington Dr
- 543 Madison St
- Plan 3 Craftsman at Riverbend Petaluma - Craftsman
- 65 Riverbend Ln
- 13 Arlington Dr
- 531 E Washington St
- 1252 Petaluma Blvd N
- 505 Petaluma Blvd N
- 228 S Mcdowell Blvd
- 304 West St
- 331 Keller St Unit 11
- 0 Lakeville St
- 210 Keller St
- 206 Park Place Dr
- 495 Cherry St
- 131 Liberty St
- 29 Alta Dr
- 20 Oakwood Dr
- 136 Court St
- 808 Arden Way
- 851 Madison St
- 804 Arden Way
- 813 Franklin Way
- 809 Franklin Way
- 809 Arden Way
- 805 Franklin Way
- 805 Arden Way
- 15 San Carlos Dr
- 801 Franklin Way
- 5 San Carlos Dr
- 841 Madison St
- 1 San Carlos Dr
- 812 Franklin Way
- 808 Franklin Way
- 804 Franklin Way
- 18 San Carlos Dr
- 22 San Carlos Dr
- 31 San Carlos Dr
- 832 Holly Ln