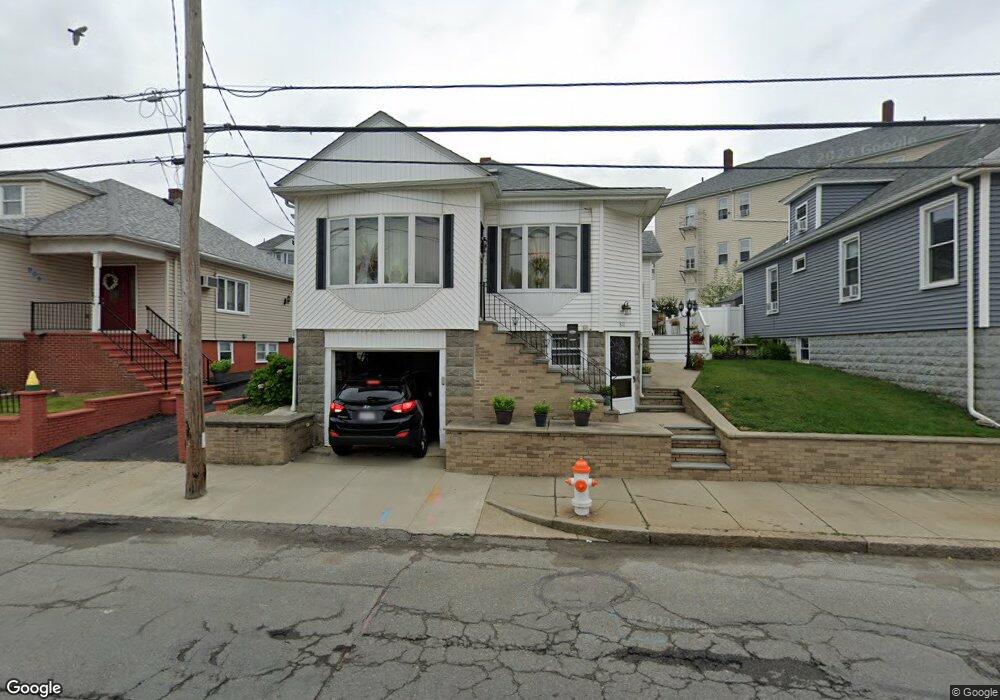
812 Bay St Fall River, MA 02724
Sandy Beach NeighborhoodEstimated Value: $349,000 - $380,903
3
Beds
1
Bath
1,151
Sq Ft
$319/Sq Ft
Est. Value
About This Home
This home is located at 812 Bay St, Fall River, MA 02724 and is currently estimated at $366,726, approximately $318 per square foot. 812 Bay St is a home located in Bristol County with nearby schools including Carlton M. Viveiros Elementary School, Matthew J. Kuss Middle School, and B M C Durfee High School.
Ownership History
Date
Name
Owned For
Owner Type
Purchase Details
Closed on
Feb 23, 2011
Sold by
Moniz Eudardo M
Bought by
Moniz Eudardo M and Moniz Maria M
Current Estimated Value
Purchase Details
Closed on
Jul 27, 1989
Sold by
Amaral Eliseu P
Bought by
Moniz Eduardo M
Home Financials for this Owner
Home Financials are based on the most recent Mortgage that was taken out on this home.
Original Mortgage
$75,000
Interest Rate
9.9%
Mortgage Type
Purchase Money Mortgage
Create a Home Valuation Report for This Property
The Home Valuation Report is an in-depth analysis detailing your home's value as well as a comparison with similar homes in the area
Home Values in the Area
Average Home Value in this Area
Purchase History
| Date | Buyer | Sale Price | Title Company |
|---|---|---|---|
| Moniz Eudardo M | -- | -- | |
| Moniz Eduardo M | $90,000 | -- |
Source: Public Records
Mortgage History
| Date | Status | Borrower | Loan Amount |
|---|---|---|---|
| Previous Owner | Moniz Eduardo M | $15,000 | |
| Previous Owner | Moniz Eduardo M | $74,400 | |
| Previous Owner | Moniz Eduardo M | $75,000 |
Source: Public Records
Tax History Compared to Growth
Tax History
| Year | Tax Paid | Tax Assessment Tax Assessment Total Assessment is a certain percentage of the fair market value that is determined by local assessors to be the total taxable value of land and additions on the property. | Land | Improvement |
|---|---|---|---|---|
| 2025 | $3,473 | $303,300 | $106,200 | $197,100 |
| 2024 | $3,240 | $282,000 | $102,300 | $179,700 |
| 2023 | $3,037 | $247,500 | $84,500 | $163,000 |
| 2022 | $2,683 | $212,600 | $80,500 | $132,100 |
| 2021 | $2,578 | $186,400 | $76,600 | $109,800 |
| 2020 | $2,510 | $173,700 | $75,500 | $98,200 |
| 2019 | $2,397 | $164,400 | $72,700 | $91,700 |
| 2018 | $2,392 | $163,600 | $78,700 | $84,900 |
| 2017 | $2,219 | $158,500 | $75,000 | $83,500 |
| 2016 | $2,169 | $159,100 | $79,800 | $79,300 |
| 2015 | $2,056 | $157,200 | $79,800 | $77,400 |
| 2014 | $1,949 | $154,900 | $77,500 | $77,400 |
Source: Public Records
Map
Nearby Homes
- 25 Winward St
- 27 Vista Way
- 160 Foote St
- 321 King St
- 24 Hall St
- 31 Barker St
- 20 Wilcox St
- 636-644 Dwelly St
- 123 Hall St
- 289 King Philip St
- 644-648 King Philip St
- 785 Broadway
- 484 S Beach St
- 1313 So Main St Unit 2
- 1334 S Main St
- 11 Palmer St
- 1273-1279 S Main St
- 36 Palmer St
- 1175 S Main St
- 1173 S Main St