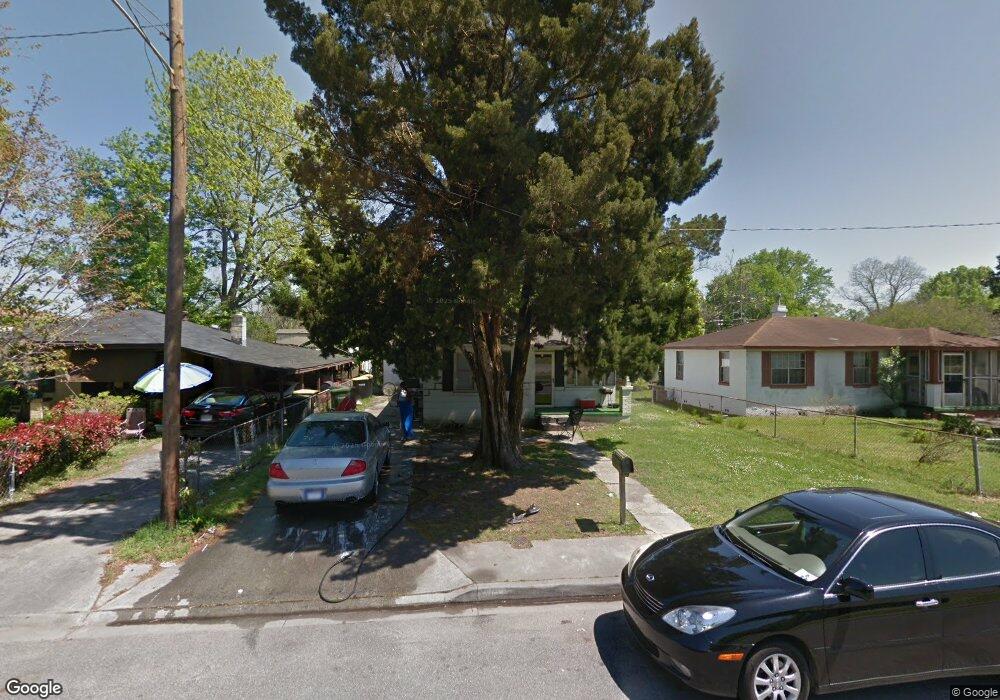
812 Carroll St Savannah, GA 31415
Carver Heights NeighborhoodEstimated Value: $189,090 - $218,000
3
Beds
2
Baths
1,337
Sq Ft
$154/Sq Ft
Est. Value
About This Home
This home is located at 812 Carroll St, Savannah, GA 31415 and is currently estimated at $205,773, approximately $153 per square foot. 812 Carroll St is a home located in Chatham County with nearby schools including Gadsden Elementary School, Derenne Middle School, and Groves High School.
Ownership History
Date
Name
Owned For
Owner Type
Purchase Details
Closed on
Jan 15, 2014
Sold by
Carroll Lorenzo
Bought by
Carroll Lorenzo and Lfc Enterprises Llc Trust
Current Estimated Value
Purchase Details
Closed on
Aug 5, 2013
Sold by
Sec Of Housing & U
Bought by
Carroll Lorenzo
Purchase Details
Closed on
Dec 17, 2012
Sold by
Well Fargo Bank Na
Bought by
Secretary Of Housing And Urban
Purchase Details
Closed on
Nov 15, 2012
Sold by
Secretary Of Housing And U
Bought by
Well Fargo Bank Na
Purchase Details
Closed on
May 17, 2012
Sold by
Wells Fargo Bank
Bought by
Sec Of Housing & Urban
Purchase Details
Closed on
May 1, 2012
Sold by
Minor Darneilia H
Bought by
Wells Fargo Bank Na
Purchase Details
Closed on
Oct 31, 2005
Sold by
Not Provided
Bought by
Minor Darneilia H
Home Financials for this Owner
Home Financials are based on the most recent Mortgage that was taken out on this home.
Original Mortgage
$93,532
Interest Rate
5.84%
Mortgage Type
FHA
Create a Home Valuation Report for This Property
The Home Valuation Report is an in-depth analysis detailing your home's value as well as a comparison with similar homes in the area
Home Values in the Area
Average Home Value in this Area
Purchase History
| Date | Buyer | Sale Price | Title Company |
|---|---|---|---|
| Carroll Lorenzo | -- | -- | |
| Carroll Lorenzo | $20,000 | -- | |
| Secretary Of Housing And Urban | -- | -- | |
| Well Fargo Bank Na | -- | -- | |
| Sec Of Housing & Urban | -- | -- | |
| Wells Fargo Bank Na | $18,400 | -- | |
| Minor Darneilia H | $95,000 | -- |
Source: Public Records
Mortgage History
| Date | Status | Borrower | Loan Amount |
|---|---|---|---|
| Previous Owner | Minor Darneilia H | $93,532 |
Source: Public Records
Tax History Compared to Growth
Tax History
| Year | Tax Paid | Tax Assessment Tax Assessment Total Assessment is a certain percentage of the fair market value that is determined by local assessors to be the total taxable value of land and additions on the property. | Land | Improvement |
|---|---|---|---|---|
| 2025 | $3,609 | $104,600 | $12,000 | $92,600 |
| 2024 | $3,609 | $94,880 | $9,000 | $85,880 |
| 2023 | $795 | $65,200 | $9,000 | $56,200 |
| 2022 | $680 | $55,720 | $6,000 | $49,720 |
| 2021 | $807 | $18,680 | $2,600 | $16,080 |
| 2020 | $590 | $18,680 | $2,600 | $16,080 |
| 2019 | $830 | $18,680 | $2,600 | $16,080 |
| 2018 | $596 | $18,880 | $2,600 | $16,280 |
| 2017 | $564 | $19,240 | $2,600 | $16,640 |
| 2016 | $567 | $19,440 | $2,600 | $16,840 |
| 2015 | $847 | $20,320 | $2,720 | $17,600 |
| 2014 | $1,162 | $20,880 | $0 | $0 |
Source: Public Records
Map
Nearby Homes
- 0 Carroll St Unit Lot 18 SA339438
- 0 Carroll St Unit SA341668
- 0 Carroll St Unit Lot 16 SA339439
- 0 Carroll St Unit 322936
- 915 Porter St
- 905 Cubbedge St
- 719 Fruit St
- 920 Crosby St
- 1036 Cornwall St
- 818 Allen Ave
- 1019 Carter St
- 1504 Cathy St
- 1018 Carter St
- 1511 Cathy St
- 1025 Elliott Ave
- 1219 Elliott Ave
- 1424 Comer St
- 1208 Mccarthy Ave
- 1417 New Castle St
- 1102 Stiles Ave