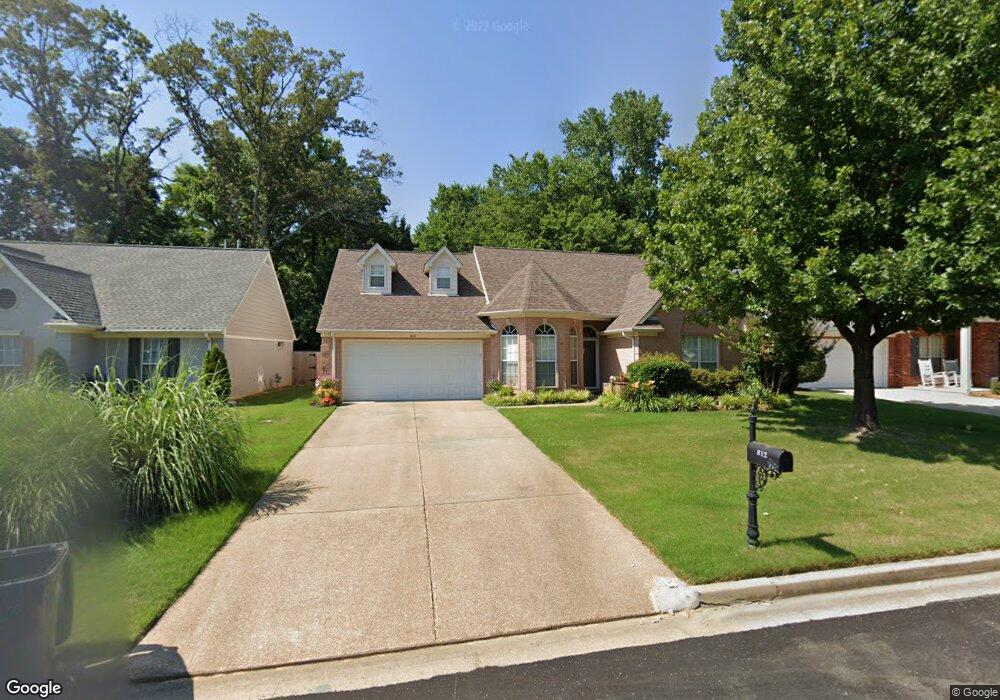
812 Cedar Trace Cir Hernando, MS 38632
Estimated Value: $297,000 - $320,000
3
Beds
2
Baths
1,741
Sq Ft
$178/Sq Ft
Est. Value
About This Home
This home is located at 812 Cedar Trace Cir, Hernando, MS 38632 and is currently estimated at $309,772, approximately $177 per square foot. 812 Cedar Trace Cir is a home located in DeSoto County with nearby schools including Oak Grove Central Elementary School, Hernando Hills Elementary, and Hernando Elementary School.
Ownership History
Date
Name
Owned For
Owner Type
Purchase Details
Closed on
Oct 22, 2020
Sold by
Metzler Steven R
Bought by
Brinkley Catherine J
Current Estimated Value
Home Financials for this Owner
Home Financials are based on the most recent Mortgage that was taken out on this home.
Original Mortgage
$131,500
Outstanding Balance
$116,432
Interest Rate
2.9%
Mortgage Type
New Conventional
Estimated Equity
$193,340
Purchase Details
Closed on
Aug 11, 2017
Sold by
Huey John A
Bought by
Brinkley Catherine J and Metzler Steven R
Home Financials for this Owner
Home Financials are based on the most recent Mortgage that was taken out on this home.
Original Mortgage
$136,000
Interest Rate
4.03%
Mortgage Type
New Conventional
Purchase Details
Closed on
Jun 2, 2011
Sold by
Crumbley Jeffery S
Bought by
Huey John A
Home Financials for this Owner
Home Financials are based on the most recent Mortgage that was taken out on this home.
Original Mortgage
$155,440
Interest Rate
4.79%
Mortgage Type
New Conventional
Create a Home Valuation Report for This Property
The Home Valuation Report is an in-depth analysis detailing your home's value as well as a comparison with similar homes in the area
Home Values in the Area
Average Home Value in this Area
Purchase History
| Date | Buyer | Sale Price | Title Company |
|---|---|---|---|
| Brinkley Catherine J | -- | Realty Title & Escrow Co Inc | |
| Brinkley Catherine J | -- | None Available | |
| Huey John A | -- | First National Title Llc |
Source: Public Records
Mortgage History
| Date | Status | Borrower | Loan Amount |
|---|---|---|---|
| Open | Brinkley Catherine J | $131,500 | |
| Previous Owner | Brinkley Catherine J | $136,000 | |
| Previous Owner | Huey John A | $155,440 |
Source: Public Records
Tax History
| Year | Tax Paid | Tax Assessment Tax Assessment Total Assessment is a certain percentage of the fair market value that is determined by local assessors to be the total taxable value of land and additions on the property. | Land | Improvement |
|---|---|---|---|---|
| 2025 | $669 | $13,240 | $2,800 | $10,440 |
| 2024 | $796 | $13,240 | $2,800 | $10,440 |
| 2023 | $796 | $13,240 | $0 | $0 |
| 2022 | $796 | $13,240 | $2,800 | $10,440 |
| 2021 | $796 | $13,240 | $2,800 | $10,440 |
| 2020 | $918 | $13,240 | $2,800 | $10,440 |
| 2019 | $0 | $13,240 | $2,800 | $10,440 |
| 2017 | $1,504 | $23,074 | $12,937 | $10,137 |
| 2016 | $1,429 | $12,937 | $2,800 | $10,137 |
| 2015 | $1,729 | $23,074 | $12,937 | $10,137 |
| 2014 | $1,388 | $12,937 | $0 | $0 |
| 2013 | $1,423 | $12,937 | $0 | $0 |
Source: Public Records
Map
Nearby Homes
- 925 Cedar Grove Pkwy
- 665 Cedar Grove Cove
- 5267 Reserve Way
- 3066 Meadows Way
- 1254 Creekside Ln
- 1567 Eden Loop
- 604 Rowan Oak Place
- 856 Cardinal Ln
- 1795 Single Tree Dr
- 1215 Courtlynn Dr
- 990 Eagle Ridge Cove
- 1794 Single Tree Dr
- 1245 Courtlynn Dr
- 1265 Courtlynn Dr
- 445 Augusta Dr
- 1070 Green T Lake W
- 1679 Sandpiper Cove N
- 208 Elkwood Ln
- 1245 Thousand Oaks Dr
- 1593 Banbury Ln
- 824 Cedar Trace Cir
- 800 Cedar Trace Cir
- 790 Cedar Trace Cir
- 836 Cedar Trace Cir
- 778 Cedar Trace Cir
- 846 Cedar Trace Cove
- 846 Cedar Trace Cir
- 773 Bending Oak S
- 817 Cedar Trace Cir
- 807 Cedar Trace Cir
- 829 Cedar Trace Cir
- 766 Cedar Trace Cir
- 795 Cedar Trace Cir
- 841 Cedar Trace Dr
- 841 Cedar Trace Cir
- 1520 Cedar Trace Dr
- 1448 Bending Oak E
- 1532 Cedar Trace Dr
- 767 Cedar Trace Cir
- 1544 Cedar Trace Dr
Your Personal Tour Guide
Ask me questions while you tour the home.