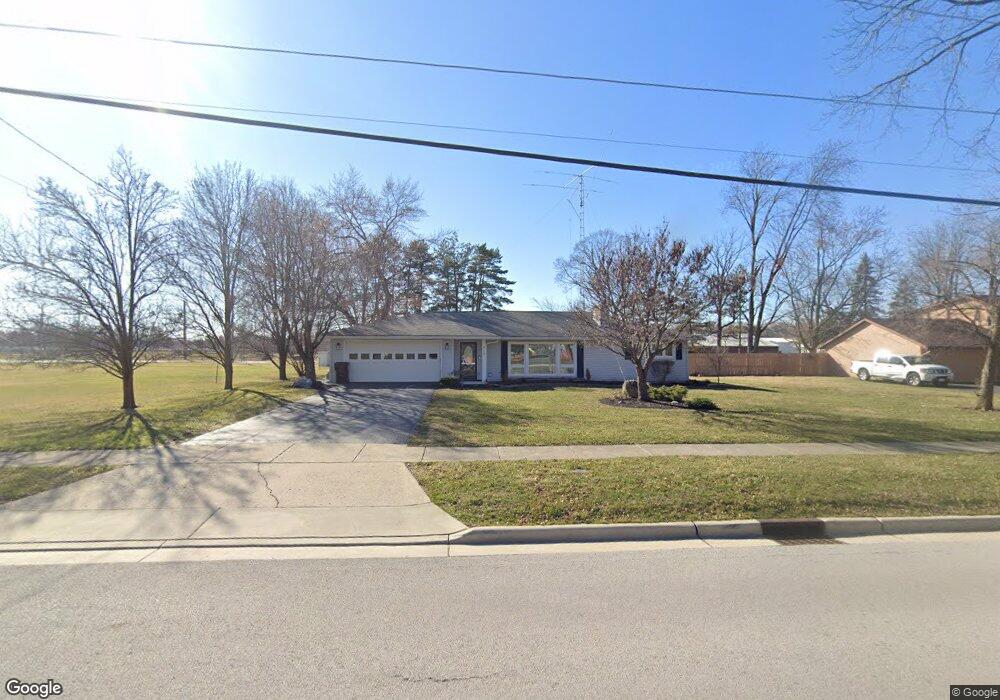
812 Fishlock Ave Findlay, OH 45840
Estimated Value: $242,000 - $275,000
3
Beds
4
Baths
2,132
Sq Ft
$118/Sq Ft
Est. Value
About This Home
This home is located at 812 Fishlock Ave, Findlay, OH 45840 and is currently estimated at $251,574, approximately $117 per square foot. 812 Fishlock Ave is a home located in Hancock County with nearby schools including Wilson Vance Elementary School, Whittier Elementary School, and Donnell Middle School.
Ownership History
Date
Name
Owned For
Owner Type
Purchase Details
Closed on
May 6, 2013
Sold by
Kayser Daniel L
Bought by
Mcmichael Jillene R and Thompson Jennifer D
Current Estimated Value
Purchase Details
Closed on
Aug 24, 2012
Sold by
Kayser Leighton
Bought by
Kayser Daniel L
Purchase Details
Closed on
Jul 25, 2008
Sold by
Kayser Daniel L and Kayser Susan E
Bought by
Kayser Daniel L and Kayser Susan E
Home Financials for this Owner
Home Financials are based on the most recent Mortgage that was taken out on this home.
Original Mortgage
$64,000
Outstanding Balance
$13,634
Interest Rate
4.9%
Mortgage Type
New Conventional
Estimated Equity
$237,940
Purchase Details
Closed on
Jun 13, 1994
Sold by
Manley Ronald
Bought by
Kayser Daniel and Mayer Susan
Home Financials for this Owner
Home Financials are based on the most recent Mortgage that was taken out on this home.
Original Mortgage
$70,000
Interest Rate
8.45%
Mortgage Type
New Conventional
Create a Home Valuation Report for This Property
The Home Valuation Report is an in-depth analysis detailing your home's value as well as a comparison with similar homes in the area
Home Values in the Area
Average Home Value in this Area
Purchase History
| Date | Buyer | Sale Price | Title Company |
|---|---|---|---|
| Mcmichael Jillene R | -- | None Available | |
| Kayser Daniel L | -- | None Available | |
| Kayser Daniel L | -- | Attorney | |
| Kayser Daniel L | -- | Assured Title | |
| Kayser Daniel | $91,000 | -- |
Source: Public Records
Mortgage History
| Date | Status | Borrower | Loan Amount |
|---|---|---|---|
| Open | Kayser Daniel L | $64,000 | |
| Closed | Kayser Daniel | $70,000 |
Source: Public Records
Tax History Compared to Growth
Tax History
| Year | Tax Paid | Tax Assessment Tax Assessment Total Assessment is a certain percentage of the fair market value that is determined by local assessors to be the total taxable value of land and additions on the property. | Land | Improvement |
|---|---|---|---|---|
| 2024 | $1,916 | $53,930 | $8,650 | $45,280 |
| 2023 | $1,919 | $53,930 | $8,650 | $45,280 |
| 2022 | $1,912 | $53,930 | $8,650 | $45,280 |
| 2021 | $1,669 | $40,960 | $9,100 | $31,860 |
| 2020 | $1,667 | $40,960 | $9,100 | $31,860 |
| 2019 | $1,633 | $40,960 | $9,100 | $31,860 |
| 2018 | $1,548 | $35,620 | $7,910 | $27,710 |
| 2017 | $774 | $35,620 | $7,910 | $27,710 |
| 2016 | $1,534 | $35,620 | $7,910 | $27,710 |
| 2015 | $1,857 | $42,470 | $9,490 | $32,980 |
| 2014 | $1,857 | $42,470 | $9,490 | $32,980 |
| 2012 | $1,843 | $41,810 | $9,490 | $32,320 |
Source: Public Records
Map
Nearby Homes
- 619 Fishlock Ave
- 15591 Canadian Way
- 15586 Canadian Way
- 15615 Canadian Way
- 1037 Fishlock Ave
- 1001 Decker Ave
- 1000 Tarra Oaks Dr
- 820 Selby St
- 309 Huron Rd
- 1109 Brookside Dr
- 1802 Lippincott Ave
- 516 Cranberry W
- 1006 Selby St
- 1464 Misty Oaks Dr
- 1301 Fishlock Ave
- 904 Morse St
- 210 Eastowne Park Row
- 1010 Country Creek Dr
- 0 Blanchard Ave
- 1200 5th St
- 804 Fishlock Ave
- 821 Fishlock Ave
- 805 Fishlock Ave
- 829 Fishlock Ave
- 734 Fishlock Ave
- 801 Fishlock Ave
- 831 Fishlock Ave
- 901 Fishlock Ave Unit A
- 901 Fishlock Ave Unit E
- 901 Fishlock Ave Unit J
- 901 Fishlock Ave Unit L
- 901 Fishlock Ave
- 720 Fishlock Ave
- 721 Fishlock Ave
- 926 Fishlock Ave
- 711 Fishlock Ave
- 709 Fishlock Ave
- 1100 Kennsington Dr
- 1130 Kennsington Dr
- 1180 Kennsington Dr