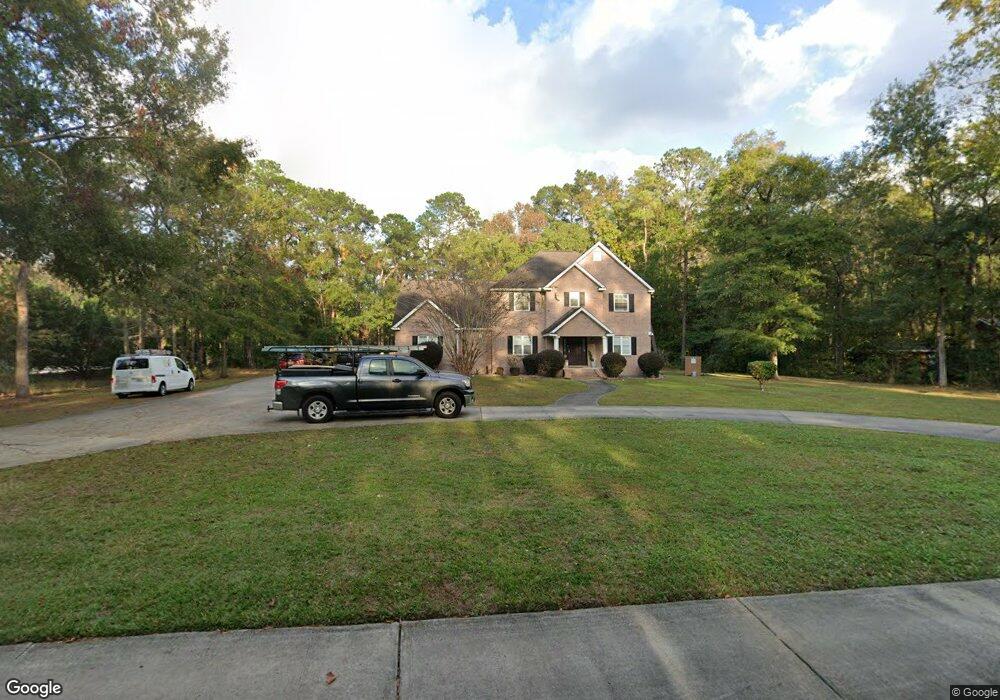
812 Forest St Hinesville, GA 31313
Estimated Value: $399,000 - $459,000
3
Beds
3
Baths
3,214
Sq Ft
$132/Sq Ft
Est. Value
About This Home
This home is located at 812 Forest St, Hinesville, GA 31313 and is currently estimated at $422,918, approximately $131 per square foot. 812 Forest St is a home located in Liberty County with nearby schools including Joseph Martin Elementary School, Midway Middle School, and Liberty County High School.
Ownership History
Date
Name
Owned For
Owner Type
Purchase Details
Closed on
Dec 28, 2020
Sold by
Chong Arder May
Bought by
Deerwood Point Llc
Current Estimated Value
Purchase Details
Closed on
Jun 5, 2006
Sold by
Hewitt Delores A
Bought by
Chong Arder May
Home Financials for this Owner
Home Financials are based on the most recent Mortgage that was taken out on this home.
Original Mortgage
$258,400
Interest Rate
6.38%
Purchase Details
Closed on
Apr 29, 2003
Sold by
Hewitt Greg
Bought by
Hewitt Delores A
Purchase Details
Closed on
Oct 6, 1999
Sold by
Hewitt Greg and Hewitt Delore
Bought by
Hewitt Greg
Purchase Details
Closed on
Jun 24, 1999
Sold by
Dinitto Vincent A
Bought by
Hewitt Greg and Hewitt Delore
Purchase Details
Closed on
Mar 1, 1996
Sold by
Jeng Wu H
Bought by
Dinitto Vincent A
Purchase Details
Closed on
Jul 3, 1979
Bought by
Jeng Wu H
Create a Home Valuation Report for This Property
The Home Valuation Report is an in-depth analysis detailing your home's value as well as a comparison with similar homes in the area
Home Values in the Area
Average Home Value in this Area
Purchase History
| Date | Buyer | Sale Price | Title Company |
|---|---|---|---|
| Deerwood Point Llc | -- | -- | |
| Chong Arder May | $323,000 | -- | |
| Hewitt Delores A | -- | -- | |
| Hewitt Greg | -- | -- | |
| Hewitt Greg | $28,000 | -- | |
| Dinitto Vincent A | $22,500 | -- | |
| Jeng Wu H | $12,900 | -- |
Source: Public Records
Mortgage History
| Date | Status | Borrower | Loan Amount |
|---|---|---|---|
| Previous Owner | Chong Arder May | $258,400 |
Source: Public Records
Tax History Compared to Growth
Tax History
| Year | Tax Paid | Tax Assessment Tax Assessment Total Assessment is a certain percentage of the fair market value that is determined by local assessors to be the total taxable value of land and additions on the property. | Land | Improvement |
|---|---|---|---|---|
| 2024 | $7,959 | $162,588 | $29,440 | $133,148 |
| 2023 | $7,959 | $146,366 | $29,440 | $116,926 |
| 2022 | $5,801 | $125,110 | $29,440 | $95,670 |
| 2021 | $5,471 | $115,834 | $29,440 | $86,394 |
| 2020 | $5,573 | $116,875 | $29,440 | $87,435 |
| 2019 | $5,580 | $117,916 | $29,440 | $88,476 |
| 2018 | $5,155 | $109,517 | $20,000 | $89,517 |
| 2017 | $3,641 | $110,558 | $20,000 | $90,558 |
| 2016 | $5,004 | $111,599 | $20,000 | $91,599 |
| 2015 | $4,902 | $111,599 | $20,000 | $91,599 |
| 2014 | $4,902 | $108,116 | $20,000 | $88,116 |
| 2013 | -- | $144,737 | $20,000 | $124,737 |
Source: Public Records
Map
Nearby Homes
- 814 Forest St
- 810 Forest St
- 1374 Forest St
- 811 Forest St
- 813 Forest St
- LOT 4 Forest St
- 119 Ali Ave
- 117 Ali Ave
- 115 Ali Ave
- 123 Ali Ave
- 817 Forest St
- 113 Ali Ave
- 888 Forest St
- 0 Forest St Unit 108284
- 0 Forest St Unit 109083
- 0 Forest St Unit 3092544
- 0 Forest St Unit 7569165
- 0 Forest St Unit 7052713
- 0 Forest St Unit 3117601
- 0 Forest St Unit 7066281