Estimated Value: $128,764 - $162,000
2
Beds
1
Bath
1,140
Sq Ft
$121/Sq Ft
Est. Value
About This Home
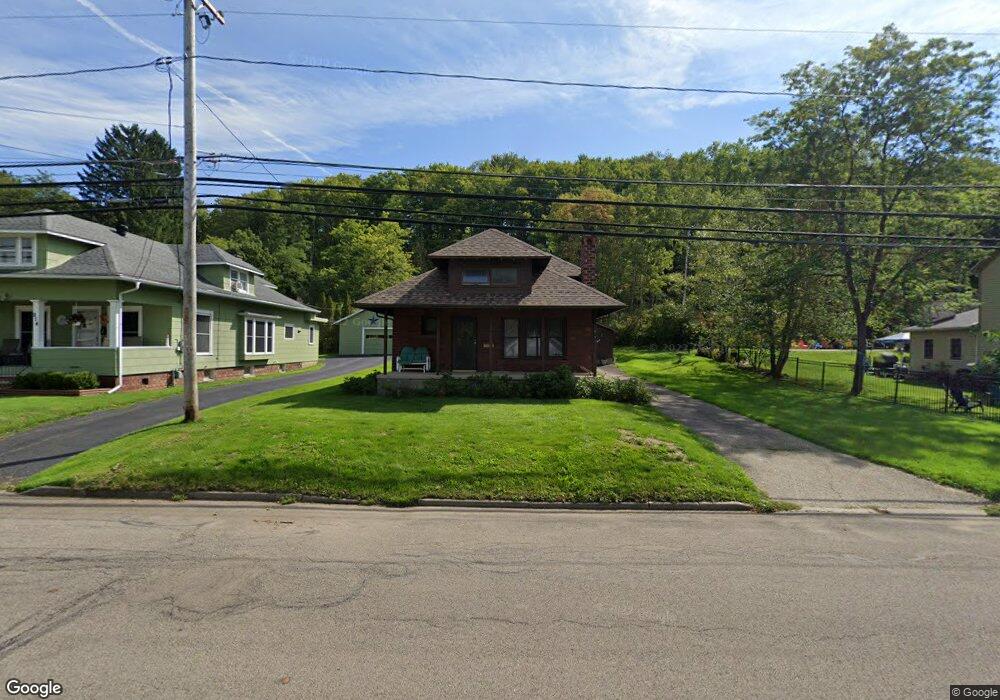
This home is located at 812 Main St, Olean, NY 14760 and is currently estimated at $138,191, approximately $121 per square foot. 812 Main St is a home located in Cattaraugus County with nearby schools including Olean Intermediate-Middle School, Olean Senior High School, and New Life Christian School.
Ownership History
Date
Name
Owned For
Owner Type
Purchase Details
Closed on
Dec 10, 2018
Sold by
Baker Cindy S
Bought by
Baker Cindy S
Current Estimated Value
Purchase Details
Closed on
Nov 15, 2018
Sold by
Baker Cindy S
Bought by
Baker Cindy S
Purchase Details
Closed on
Aug 27, 2018
Sold by
Baker Cindy S
Bought by
Baker Linda L
Purchase Details
Closed on
Aug 23, 2018
Sold by
Baker Cindy S
Bought by
Baker Linda L
Purchase Details
Closed on
Aug 8, 1996
Sold by
Vanderhoof Lewis Phyllis I
Bought by
Baker Cindy S
Create a Home Valuation Report for This Property
The Home Valuation Report is an in-depth analysis detailing your home's value as well as a comparison with similar homes in the area
Home Values in the Area
Average Home Value in this Area
Purchase History
| Date | Buyer | Sale Price | Title Company |
|---|---|---|---|
| Baker Cindy S | -- | None Available | |
| Baker Cindy S | -- | None Available | |
| Baker Cindy S | -- | -- | |
| Baker Linda L | -- | None Available | |
| Baker Linda L | -- | None Available | |
| Baker Linda L | -- | -- | |
| Baker Cindy S | $55,000 | -- |
Source: Public Records
Tax History
| Year | Tax Paid | Tax Assessment Tax Assessment Total Assessment is a certain percentage of the fair market value that is determined by local assessors to be the total taxable value of land and additions on the property. | Land | Improvement |
|---|---|---|---|---|
| 2025 | $4,742 | $75,000 | $17,100 | $57,900 |
| 2024 | $4,742 | $75,000 | $17,100 | $57,900 |
| 2023 | $2,824 | $75,000 | $17,100 | $57,900 |
| 2022 | $2,864 | $75,000 | $17,100 | $57,900 |
| 2021 | $2,947 | $75,000 | $17,100 | $57,900 |
| 2020 | $2,327 | $75,000 | $17,100 | $57,900 |
| 2019 | $1,126 | $75,000 | $17,100 | $57,900 |
| 2018 | $3,404 | $75,000 | $17,100 | $57,900 |
| 2017 | $2,364 | $75,000 | $17,100 | $57,900 |
| 2016 | $2,313 | $75,000 | $17,100 | $57,900 |
| 2015 | -- | $75,000 | $17,100 | $57,900 |
| 2014 | -- | $75,000 | $17,100 | $57,900 |
Source: Public Records
Map
Nearby Homes
Your Personal Tour Guide
Ask me questions while you tour the home.