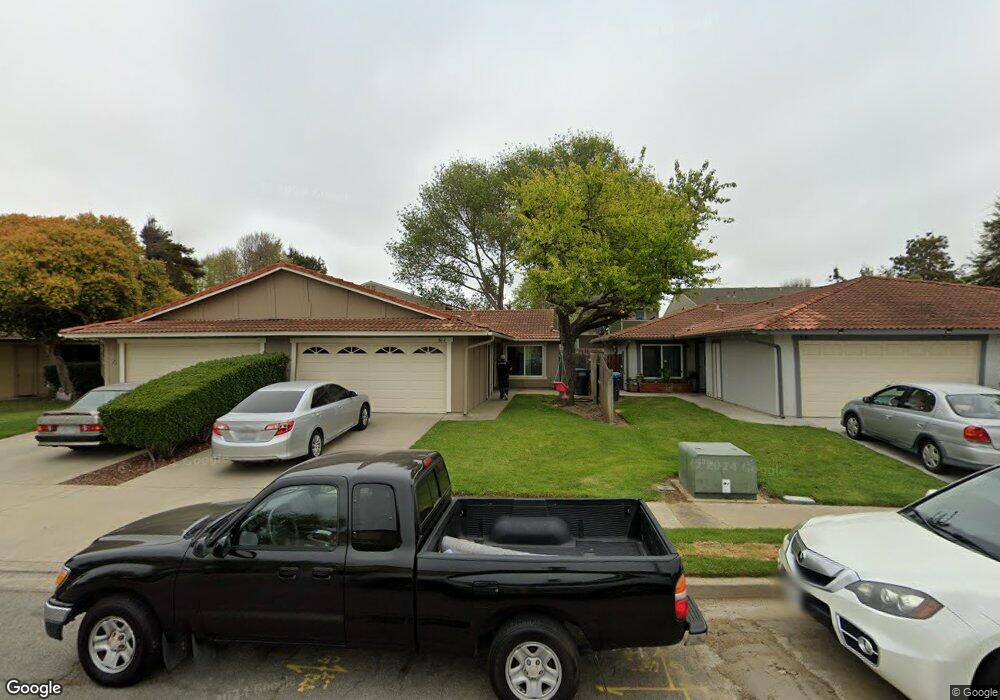
812 N L St Lompoc, CA 93436
Estimated Value: $395,200 - $438,000
2
Beds
2
Baths
952
Sq Ft
$430/Sq Ft
Est. Value
About This Home
This home is located at 812 N L St, Lompoc, CA 93436 and is currently estimated at $409,050, approximately $429 per square foot. 812 N L St is a home located in Santa Barbara County with nearby schools including La Canada Elementary School, Lompoc Valley Middle School, and Lompoc High School.
Ownership History
Date
Name
Owned For
Owner Type
Purchase Details
Closed on
May 5, 2021
Sold by
Solorlo Robert L
Bought by
Ramos Leticia and De Jesus Ramos
Current Estimated Value
Home Financials for this Owner
Home Financials are based on the most recent Mortgage that was taken out on this home.
Original Mortgage
$316,350
Interest Rate
2.9%
Mortgage Type
New Conventional
Purchase Details
Closed on
Jun 19, 2017
Sold by
Solorio Robert L and Solorio Angela
Bought by
Solorio Robert L
Purchase Details
Closed on
Nov 21, 2006
Sold by
Solorio Robert L
Bought by
Solorio Robert L
Create a Home Valuation Report for This Property
The Home Valuation Report is an in-depth analysis detailing your home's value as well as a comparison with similar homes in the area
Home Values in the Area
Average Home Value in this Area
Purchase History
| Date | Buyer | Sale Price | Title Company |
|---|---|---|---|
| Ramos Leticia | $333,000 | Fidelity National Title Co | |
| Solorio Robert L | -- | Orange Coast Title Company | |
| Solorio Robert L | -- | None Available |
Source: Public Records
Mortgage History
| Date | Status | Borrower | Loan Amount |
|---|---|---|---|
| Previous Owner | Ramos Leticia | $316,350 |
Source: Public Records
Tax History
| Year | Tax Paid | Tax Assessment Tax Assessment Total Assessment is a certain percentage of the fair market value that is determined by local assessors to be the total taxable value of land and additions on the property. | Land | Improvement |
|---|---|---|---|---|
| 2025 | $3,919 | $360,448 | $189,425 | $171,023 |
| 2023 | $3,919 | $346,453 | $182,070 | $164,383 |
| 2022 | $3,852 | $339,660 | $178,500 | $161,160 |
| 2021 | $1,945 | $164,957 | $56,049 | $108,908 |
| 2020 | $1,925 | $163,267 | $55,475 | $107,792 |
| 2019 | $1,893 | $160,067 | $54,388 | $105,679 |
| 2018 | $1,863 | $156,929 | $53,322 | $103,607 |
| 2017 | $1,830 | $153,853 | $52,277 | $101,576 |
| 2016 | $1,797 | $150,837 | $51,252 | $99,585 |
| 2014 | $1,758 | $145,664 | $49,495 | $96,169 |
Source: Public Records
Map
Nearby Homes
- 321 W North Ave Unit 133
- 526 N L St
- 901 Alden Ave
- 531 N O St
- 510 N I St
- 1012 W Anthony Way
- 321 N K St
- 217 N M St
- 610 E Pine Ave Unit 10
- 610 E Pine Ave Unit 29
- 600 N Larkspur St
- 516 N U St
- 701 E Pine Ave Unit 182
- 701 E Pine Ave Unit 176
- 701 E Pine Ave Unit 171
- 701 E Pine Ave Unit 161
- 1355 Crown Cir
- 1407 N H St
- 1011 W Walnut Ave
- 622 N B St
Your Personal Tour Guide
Ask me questions while you tour the home.