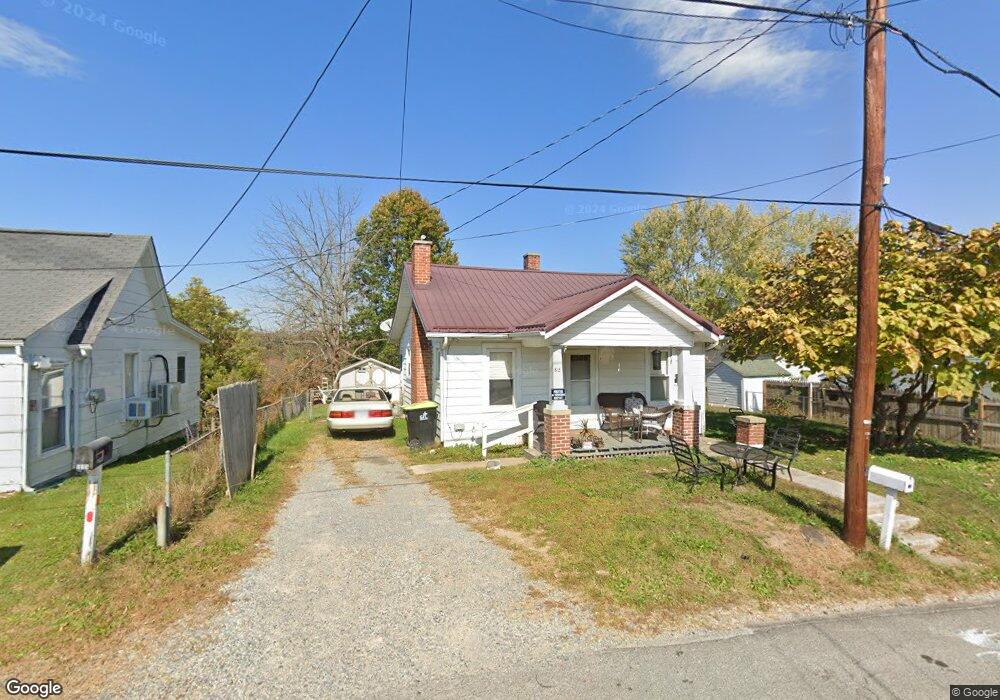
812 Paca St Pulaski, VA 24301
Estimated Value: $66,000 - $125,000
2
Beds
1
Bath
925
Sq Ft
$98/Sq Ft
Est. Value
About This Home
This home is located at 812 Paca St, Pulaski, VA 24301 and is currently estimated at $90,505, approximately $97 per square foot. 812 Paca St is a home located in Pulaski County with nearby schools including Critzer Elementary School, Pulaski County Middle School, and Pulaski County High School.
Ownership History
Date
Name
Owned For
Owner Type
Purchase Details
Closed on
Mar 13, 2015
Sold by
Virginia Housing Development A
Bought by
Underwood Andreas D
Current Estimated Value
Purchase Details
Closed on
Jun 5, 2008
Sold by
Cox Loria L
Bought by
Hinkley Brandon R
Home Financials for this Owner
Home Financials are based on the most recent Mortgage that was taken out on this home.
Original Mortgage
$66,300
Interest Rate
6.11%
Mortgage Type
New Conventional
Create a Home Valuation Report for This Property
The Home Valuation Report is an in-depth analysis detailing your home's value as well as a comparison with similar homes in the area
Home Values in the Area
Average Home Value in this Area
Purchase History
| Date | Buyer | Sale Price | Title Company |
|---|---|---|---|
| Underwood Andreas D | $29,000 | -- | |
| Hinkley Brandon R | $64,500 | -- |
Source: Public Records
Mortgage History
| Date | Status | Borrower | Loan Amount |
|---|---|---|---|
| Previous Owner | Hinkley Brandon R | $66,300 |
Source: Public Records
Tax History Compared to Growth
Tax History
| Year | Tax Paid | Tax Assessment Tax Assessment Total Assessment is a certain percentage of the fair market value that is determined by local assessors to be the total taxable value of land and additions on the property. | Land | Improvement |
|---|---|---|---|---|
| 2025 | $356 | $48,100 | $4,500 | $43,600 |
| 2024 | $356 | $48,100 | $4,500 | $43,600 |
| 2023 | $356 | $48,100 | $4,500 | $43,600 |
| 2022 | $356 | $48,100 | $4,500 | $43,600 |
| 2021 | $356 | $48,100 | $4,500 | $43,600 |
| 2020 | $311 | $40,400 | $2,500 | $37,900 |
| 2019 | $311 | $40,400 | $2,500 | $37,900 |
| 2018 | $311 | $40,400 | $2,500 | $37,900 |
| 2017 | $259 | $40,400 | $2,500 | $37,900 |
| 2016 | $259 | $40,400 | $2,500 | $37,900 |
| 2015 | $317 | $40,400 | $2,500 | $37,900 |
| 2014 | $317 | $53,700 | $2,500 | $51,200 |
| 2013 | $317 | $53,700 | $2,500 | $51,200 |
Source: Public Records
Map
Nearby Homes
- 59,204,218,546 Bertha and Bunts St
- 820 Martin Ave
- 129 Cliff St
- 841 Front St
- 422 Pulaski St
- 224 Lagrange St
- 217 Lagrange St
- 24 Howard St
- 129 Fayette St
- 151 Valley St
- 501 Maple St
- 1404 Case Knife Rd
- 231 Randolph Ave
- 222&230 Randolph Ave
- 238 3rd St NW
- 422 S Washington Ave
- 221 S Washington Ave
- 311 S Washington Ave
- 315 S Washington Ave
- 1703 Case Knife Rd