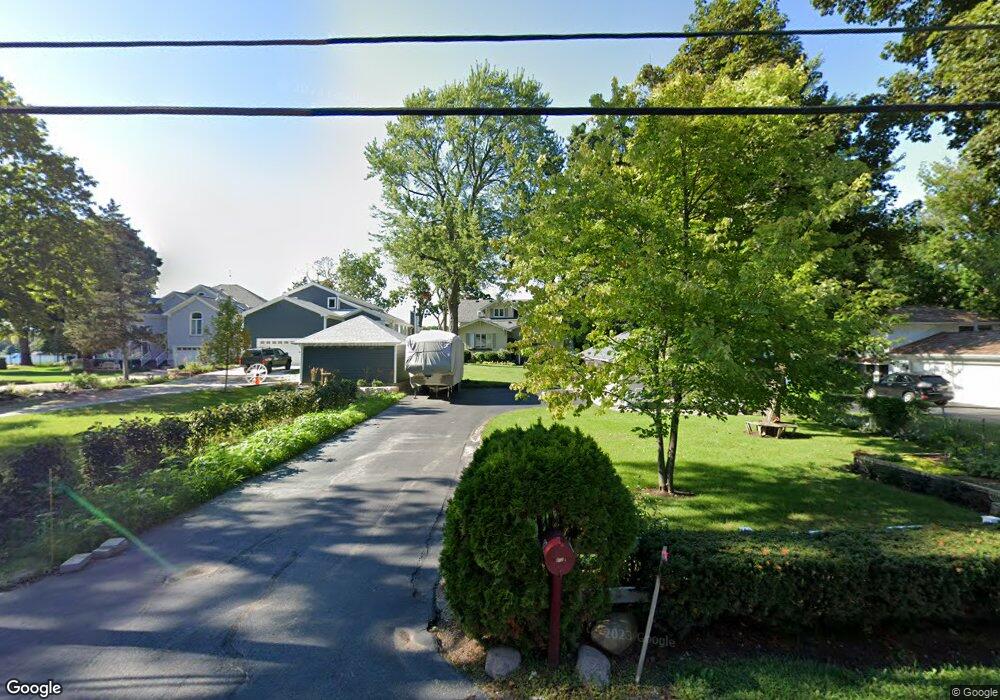
812 Regner Rd McHenry, IL 60051
West Palm Beach NeighborhoodEstimated Value: $515,000 - $872,000
Studio
4
Baths
2,782
Sq Ft
$243/Sq Ft
Est. Value
About This Home
This home is located at 812 Regner Rd, McHenry, IL 60051 and is currently estimated at $675,067, approximately $242 per square foot. 812 Regner Rd is a home located in McHenry County with nearby schools including Hilltop Elementary School, Chauncey H Duker School, and Mchenry Middle School.
Ownership History
Date
Name
Owned For
Owner Type
Purchase Details
Closed on
Jan 30, 2002
Sold by
Pottebaum Gerald W and Pottebaum Lynn M
Bought by
Pottebaum Gerald W and Pottebaum Lynn M
Current Estimated Value
Purchase Details
Closed on
Jun 15, 2000
Sold by
Merchant Gail A
Bought by
Pottebaum Gerald W and Pottebaum Lynn M
Home Financials for this Owner
Home Financials are based on the most recent Mortgage that was taken out on this home.
Original Mortgage
$200,000
Outstanding Balance
$72,715
Interest Rate
8.66%
Estimated Equity
$602,352
Purchase Details
Closed on
Nov 19, 1997
Sold by
Merchant Jack and Merchant Gail
Bought by
Merchant Gail A
Purchase Details
Closed on
Oct 28, 1996
Sold by
Cole Taylor Bank
Bought by
Merchant Jack and Merchant Gail
Home Financials for this Owner
Home Financials are based on the most recent Mortgage that was taken out on this home.
Original Mortgage
$370,000
Interest Rate
8.26%
Create a Home Valuation Report for This Property
The Home Valuation Report is an in-depth analysis detailing your home's value as well as a comparison with similar homes in the area
Home Values in the Area
Average Home Value in this Area
Purchase History
| Date | Buyer | Sale Price | Title Company |
|---|---|---|---|
| Pottebaum Gerald W | -- | -- | |
| Pottebaum Gerald W | $502,500 | Plm Title Company | |
| Merchant Gail A | -- | -- | |
| Merchant Jack | $495,000 | Chicago Title |
Source: Public Records
Mortgage History
| Date | Status | Borrower | Loan Amount |
|---|---|---|---|
| Open | Pottebaum Gerald W | $200,000 | |
| Previous Owner | Merchant Jack | $370,000 |
Source: Public Records
Tax History
| Year | Tax Paid | Tax Assessment Tax Assessment Total Assessment is a certain percentage of the fair market value that is determined by local assessors to be the total taxable value of land and additions on the property. | Land | Improvement |
|---|---|---|---|---|
| 2024 | $15,811 | $213,680 | $63,076 | $150,604 |
| 2023 | $17,002 | $210,928 | $56,510 | $154,418 |
| 2022 | $14,381 | $171,794 | $52,426 | $119,368 |
| 2021 | $13,674 | $159,987 | $48,823 | $111,164 |
| 2020 | $13,210 | $153,318 | $46,788 | $106,530 |
| 2019 | $14,551 | $161,737 | $44,429 | $117,308 |
| 2018 | $15,430 | $154,403 | $42,414 | $111,989 |
| 2017 | $14,817 | $144,912 | $39,807 | $105,105 |
| 2016 | $14,326 | $135,432 | $37,203 | $98,229 |
| 2013 | -- | $133,721 | $36,629 | $97,092 |
Source: Public Records
Map
Nearby Homes
- 817 Regner Rd
- Lot 2 Pitzen Rd
- 28986 W Manitoba Trail
- 34757 N Iroquois Trail
- 1606 W August Ln
- 1304 River Terrace Dr
- Lot 1-5 N Lewis Ln
- 520 Bald Knob Rd
- 4018 Pitzen Rd
- Lot 6&7 Pistakee View Dr
- 3114 Chapel Hill Rd
- 3118 N Chapel Hill Rd
- 35100 N Indian Trail
- 912 River Terrace Dr
- 28529 W Treetop Rd
- 28448 W Big Hollow Rd
- 34940 N Leonard Ave
- 1322 Lakeview St
- 34945 N Leonard Ave
- 2908 Oakwood Ave
Your Personal Tour Guide
Ask me questions while you tour the home.