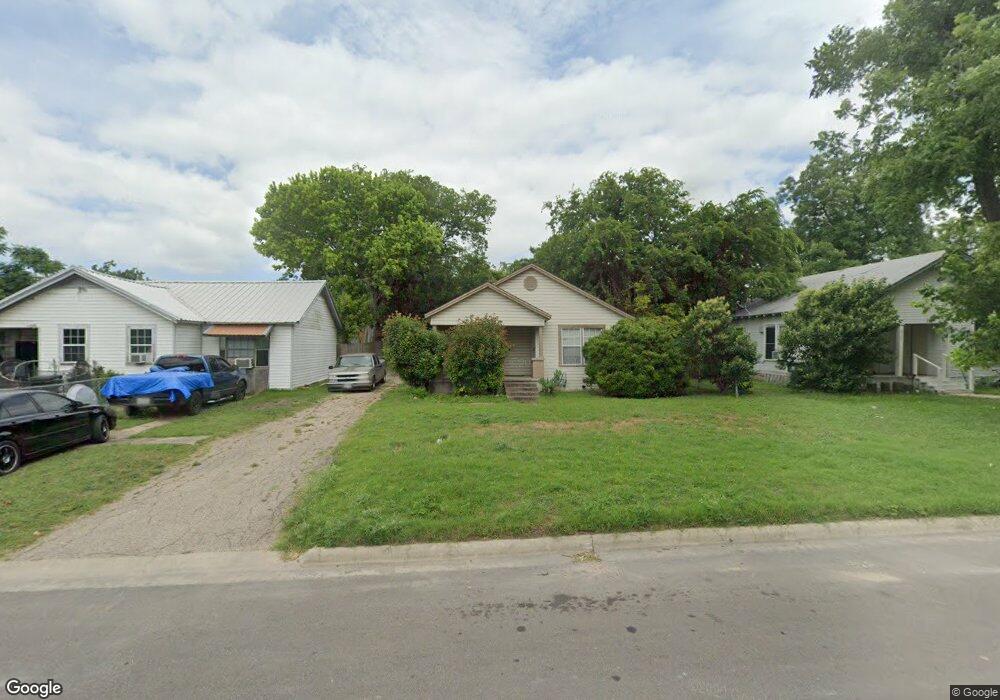
812 S 23rd St Temple, TX 76504
Midtown District NeighborhoodEstimated Value: $150,000 - $177,000
3
Beds
1
Bath
1,096
Sq Ft
$147/Sq Ft
Est. Value
About This Home
This home is located at 812 S 23rd St, Temple, TX 76504 and is currently estimated at $160,657, approximately $146 per square foot. 812 S 23rd St is a home located in Bell County with nearby schools including Scott Elementary School, Travis Science Academy, and Temple High School.
Ownership History
Date
Name
Owned For
Owner Type
Purchase Details
Closed on
Jul 25, 2022
Sold by
Lee Mauldin James
Bought by
Harris Bryan
Current Estimated Value
Home Financials for this Owner
Home Financials are based on the most recent Mortgage that was taken out on this home.
Original Mortgage
$109,250
Outstanding Balance
$104,064
Interest Rate
5.23%
Mortgage Type
New Conventional
Estimated Equity
$56,593
Purchase Details
Closed on
Jun 15, 2007
Sold by
Eubanks Bryan and Eubanks Tonya
Bought by
Mauldin James Lee
Home Financials for this Owner
Home Financials are based on the most recent Mortgage that was taken out on this home.
Original Mortgage
$30,750
Interest Rate
6.15%
Mortgage Type
Purchase Money Mortgage
Purchase Details
Closed on
Dec 2, 1997
Sold by
Meyer Darell W and Meyer Julia O
Bought by
Matrix Financial Services
Create a Home Valuation Report for This Property
The Home Valuation Report is an in-depth analysis detailing your home's value as well as a comparison with similar homes in the area
Home Values in the Area
Average Home Value in this Area
Purchase History
| Date | Buyer | Sale Price | Title Company |
|---|---|---|---|
| Harris Bryan | -- | First Community Title Services | |
| Mauldin James Lee | -- | Centraland Title Company | |
| Matrix Financial Services | $31,500 | -- |
Source: Public Records
Mortgage History
| Date | Status | Borrower | Loan Amount |
|---|---|---|---|
| Open | Harris Bryan | $109,250 | |
| Previous Owner | Mauldin James Lee | $30,750 |
Source: Public Records
Tax History Compared to Growth
Tax History
| Year | Tax Paid | Tax Assessment Tax Assessment Total Assessment is a certain percentage of the fair market value that is determined by local assessors to be the total taxable value of land and additions on the property. | Land | Improvement |
|---|---|---|---|---|
| 2025 | $2,657 | $141,837 | $29,750 | $112,087 |
| 2024 | $2,657 | $113,627 | $29,050 | $84,577 |
| 2023 | $2,710 | $118,184 | $24,150 | $94,034 |
| 2022 | $2,400 | $100,225 | $15,960 | $84,265 |
| 2021 | $2,182 | $85,048 | $7,000 | $78,048 |
| 2020 | $2,122 | $79,067 | $6,750 | $72,317 |
| 2019 | $2,010 | $73,563 | $3,000 | $70,563 |
| 2018 | $1,268 | $46,016 | $3,000 | $43,016 |
| 2017 | $1,256 | $45,863 | $3,000 | $42,863 |
| 2016 | $1,189 | $43,425 | $3,000 | $40,425 |
| 2015 | $1,109 | $42,664 | $3,000 | $39,664 |
| 2014 | $1,109 | $42,145 | $0 | $0 |
Source: Public Records
Map
Nearby Homes