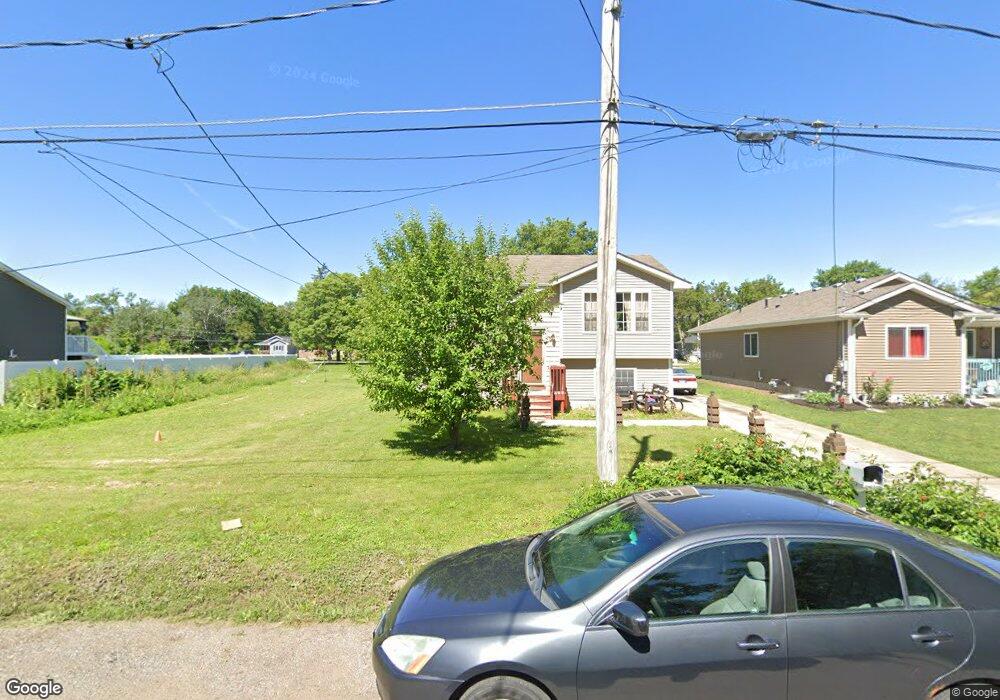
812 SE 28th St Des Moines, IA 50317
Chesterfield NeighborhoodEstimated Value: $206,000 - $262,000
4
Beds
2
Baths
798
Sq Ft
$289/Sq Ft
Est. Value
About This Home
This home is located at 812 SE 28th St, Des Moines, IA 50317 and is currently estimated at $230,940, approximately $289 per square foot. 812 SE 28th St is a home located in Polk County with nearby schools including Willard Elementary School, Hoyt Middle School, and East High School.
Ownership History
Date
Name
Owned For
Owner Type
Purchase Details
Closed on
Aug 30, 2013
Sold by
Lab Investments Company Inc
Bought by
Phanthoudeth Sam
Current Estimated Value
Home Financials for this Owner
Home Financials are based on the most recent Mortgage that was taken out on this home.
Original Mortgage
$119,352
Outstanding Balance
$90,018
Interest Rate
4.75%
Mortgage Type
FHA
Estimated Equity
$140,922
Purchase Details
Closed on
Dec 22, 2010
Sold by
Lab Investment Company Inc
Bought by
Phanthoudeth Sam
Home Financials for this Owner
Home Financials are based on the most recent Mortgage that was taken out on this home.
Original Mortgage
$129,000
Interest Rate
7.5%
Mortgage Type
Seller Take Back
Purchase Details
Closed on
Dec 31, 2009
Sold by
Ross Amy
Bought by
Lab Investment Company Inc
Purchase Details
Closed on
May 11, 2009
Sold by
Lab Investment Company Inc
Bought by
Ross Amy
Purchase Details
Closed on
Apr 18, 2007
Sold by
Modde Dennis J and Modde Kay A
Bought by
Lab Investment Co Inc
Create a Home Valuation Report for This Property
The Home Valuation Report is an in-depth analysis detailing your home's value as well as a comparison with similar homes in the area
Home Values in the Area
Average Home Value in this Area
Purchase History
| Date | Buyer | Sale Price | Title Company |
|---|---|---|---|
| Phanthoudeth Sam | $140,000 | None Available | |
| Phanthoudeth Sam | $139,900 | None Available | |
| Lab Investment Company Inc | -- | None Available | |
| Ross Amy | -- | None Available | |
| Lab Investment Co Inc | $1,500 | None Available |
Source: Public Records
Mortgage History
| Date | Status | Borrower | Loan Amount |
|---|---|---|---|
| Open | Phanthoudeth Sam | $119,352 | |
| Previous Owner | Phanthoudeth Sam | $129,000 |
Source: Public Records
Tax History Compared to Growth
Tax History
| Year | Tax Paid | Tax Assessment Tax Assessment Total Assessment is a certain percentage of the fair market value that is determined by local assessors to be the total taxable value of land and additions on the property. | Land | Improvement |
|---|---|---|---|---|
| 2025 | $3,762 | $218,100 | $9,800 | $208,300 |
| 2024 | $3,762 | $191,200 | $8,500 | $182,700 |
| 2023 | $3,858 | $191,200 | $8,500 | $182,700 |
| 2022 | $3,828 | $163,700 | $7,400 | $156,300 |
| 2021 | $3,600 | $163,700 | $7,400 | $156,300 |
| 2020 | $3,740 | $144,300 | $6,500 | $137,800 |
| 2019 | $200 | $144,300 | $6,500 | $137,800 |
| 2018 | $198 | $125,700 | $5,600 | $120,100 |
| 2017 | $122 | $125,700 | $5,600 | $120,100 |
| 2016 | $120 | $122,800 | $5,300 | $117,500 |
| 2015 | $120 | $122,800 | $5,300 | $117,500 |
| 2014 | $106 | $120,400 | $5,100 | $115,300 |
Source: Public Records
Map
Nearby Homes