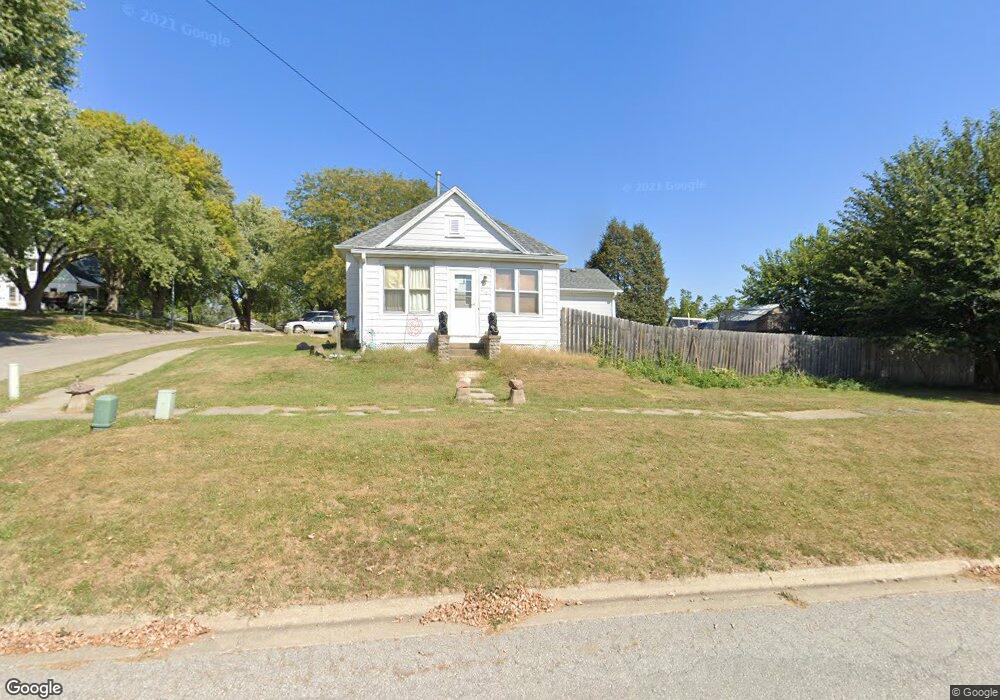
812 Spring St Harlan, IA 51537
Estimated Value: $114,000 - $159,000
3
Beds
2
Baths
1,446
Sq Ft
$96/Sq Ft
Est. Value
About This Home
This home is located at 812 Spring St, Harlan, IA 51537 and is currently estimated at $138,560, approximately $95 per square foot. 812 Spring St is a home located in Shelby County with nearby schools including Harlan Primary School, Harlan Intermediate School, and Harlan Community Middle School.
Ownership History
Date
Name
Owned For
Owner Type
Purchase Details
Closed on
Oct 22, 2015
Sold by
Wingert Wayne and Wingert Debra
Bought by
Smith Kenneth and Smith Corinna
Current Estimated Value
Home Financials for this Owner
Home Financials are based on the most recent Mortgage that was taken out on this home.
Original Mortgage
$74,500
Outstanding Balance
$61,030
Interest Rate
3.91%
Mortgage Type
USDA
Estimated Equity
$77,530
Purchase Details
Closed on
Jun 17, 2015
Sold by
Kramer Mary Ann
Bought by
Wingert Wayne
Purchase Details
Closed on
Jun 27, 2008
Sold by
Martin Karla Rae
Bought by
Kramer Mary Ann
Create a Home Valuation Report for This Property
The Home Valuation Report is an in-depth analysis detailing your home's value as well as a comparison with similar homes in the area
Home Values in the Area
Average Home Value in this Area
Purchase History
| Date | Buyer | Sale Price | Title Company |
|---|---|---|---|
| Smith Kenneth | $70,000 | None Available | |
| Wingert Wayne | -- | None Available | |
| Kramer Mary Ann | -- | None Available |
Source: Public Records
Mortgage History
| Date | Status | Borrower | Loan Amount |
|---|---|---|---|
| Open | Smith Kenneth | $74,500 |
Source: Public Records
Tax History Compared to Growth
Tax History
| Year | Tax Paid | Tax Assessment Tax Assessment Total Assessment is a certain percentage of the fair market value that is determined by local assessors to be the total taxable value of land and additions on the property. | Land | Improvement |
|---|---|---|---|---|
| 2025 | $1,718 | $121,791 | $11,440 | $110,351 |
| 2024 | $1,718 | $102,085 | $11,440 | $90,645 |
| 2023 | $1,598 | $102,085 | $11,440 | $90,645 |
| 2022 | $1,598 | $85,567 | $11,440 | $74,127 |
| 2021 | $1,492 | $85,567 | $11,440 | $74,127 |
| 2020 | $1,054 | $75,708 | $11,440 | $64,268 |
| 2019 | $958 | $69,281 | $0 | $0 |
| 2018 | $920 | $69,281 | $0 | $0 |
| 2017 | $920 | $69,281 | $0 | $0 |
| 2016 | $1,160 | $63,460 | $0 | $0 |
| 2015 | $1,160 | $63,460 | $0 | $0 |
| 2014 | $324 | $63,460 | $0 | $0 |
Source: Public Records
Map
Nearby Homes