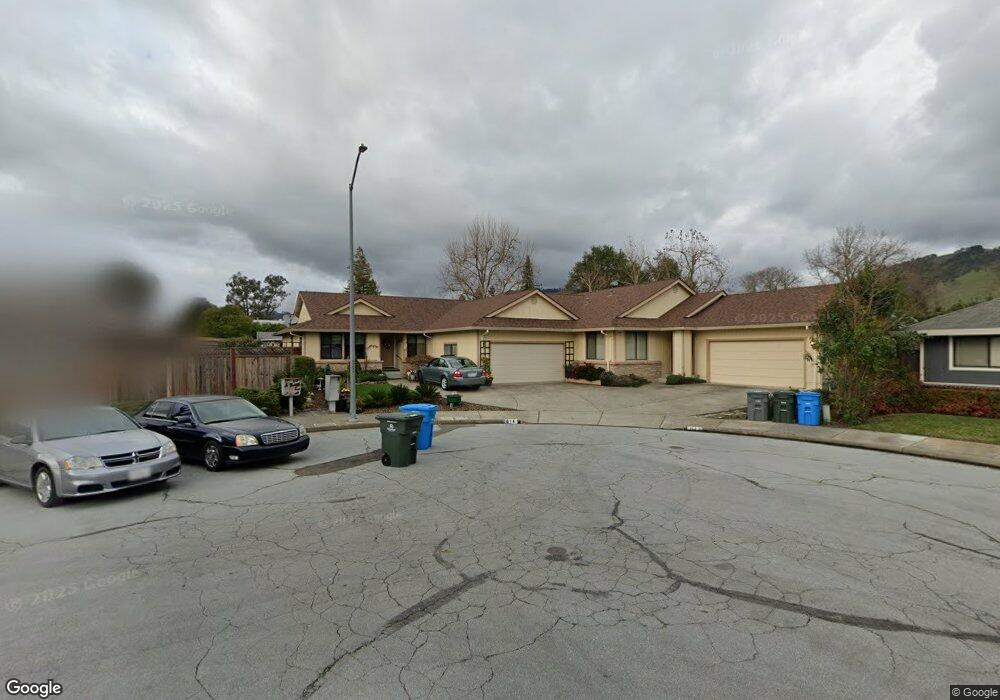
812 Swift Ct Santa Rosa, CA 95409
Middle Rincon NeighborhoodEstimated Value: $951,000 - $1,189,269
6
Beds
4
Baths
2,796
Sq Ft
$378/Sq Ft
Est. Value
About This Home
This home is located at 812 Swift Ct, Santa Rosa, CA 95409 and is currently estimated at $1,057,567, approximately $378 per square foot. 812 Swift Ct is a home located in Sonoma County with nearby schools including Rincon Valley Middle School, Maria Carrillo High School, and Binkley Elementary Charter School.
Ownership History
Date
Name
Owned For
Owner Type
Purchase Details
Closed on
Mar 7, 2024
Sold by
Christian Jolly W and Christian Denise
Bought by
Jolly W Christian And Denise Christian Revoca and Selby Family 2006 Trust
Current Estimated Value
Purchase Details
Closed on
Apr 25, 2018
Sold by
Jc Swift Partners Lp
Bought by
Christian Jolly W and Christian Denise
Home Financials for this Owner
Home Financials are based on the most recent Mortgage that was taken out on this home.
Original Mortgage
$640,000
Interest Rate
4.44%
Mortgage Type
Purchase Money Mortgage
Purchase Details
Closed on
Jan 5, 2000
Sold by
Swift Jerry D and Swift Catherine G
Bought by
Jc Swift Partners Lp
Purchase Details
Closed on
Jun 24, 1996
Sold by
Swift Jerry D and Swift Catherine G
Bought by
Swift Jerry D and Swift Catherine G
Create a Home Valuation Report for This Property
The Home Valuation Report is an in-depth analysis detailing your home's value as well as a comparison with similar homes in the area
Home Values in the Area
Average Home Value in this Area
Purchase History
| Date | Buyer | Sale Price | Title Company |
|---|---|---|---|
| Jolly W Christian And Denise Christian Revoca | -- | None Listed On Document | |
| Jolly W Christian And Denise Christian Revoca | -- | None Listed On Document | |
| Christian Jolly W | $800,000 | Fidelity National Title Co | |
| Jc Swift Partners Lp | -- | -- | |
| Swift Jerry D | -- | -- |
Source: Public Records
Mortgage History
| Date | Status | Borrower | Loan Amount |
|---|---|---|---|
| Previous Owner | Christian Jolly W | $640,000 |
Source: Public Records
Tax History Compared to Growth
Tax History
| Year | Tax Paid | Tax Assessment Tax Assessment Total Assessment is a certain percentage of the fair market value that is determined by local assessors to be the total taxable value of land and additions on the property. | Land | Improvement |
|---|---|---|---|---|
| 2025 | $11,759 | $1,024,041 | $409,616 | $614,425 |
| 2024 | $11,759 | $1,003,963 | $401,585 | $602,378 |
| 2023 | $11,759 | $984,278 | $393,711 | $590,567 |
| 2022 | $10,856 | $964,980 | $385,992 | $578,988 |
| 2021 | $10,641 | $946,060 | $378,424 | $567,636 |
| 2020 | $10,602 | $936,360 | $374,544 | $561,816 |
| 2019 | $10,506 | $918,000 | $367,200 | $550,800 |
| 2018 | $3,615 | $299,191 | $45,822 | $253,369 |
| 2017 | $3,549 | $293,325 | $44,924 | $248,401 |
| 2016 | $3,507 | $287,575 | $44,044 | $243,531 |
| 2015 | $3,403 | $283,256 | $43,383 | $239,873 |
| 2014 | $3,281 | $277,709 | $42,534 | $235,175 |
Source: Public Records
Map
Nearby Homes
- 13 Redwood Ct
- 103 Glenoak Ct
- 164 Brookview Ct
- 2429 Woodstock Ct
- 0 Bridgewood Dr
- 4306 Cox Ct
- 5012 Parkhurst Dr
- 4316 Fistor Dr
- 4526 Patrick Ct
- 5025 Parkhurst Dr
- 4781 Granada Dr
- 4301 Fistor Dr
- 4500 Fistor Dr
- 2472 Creek Meadow Dr
- 71 Oakcreek Ct
- 2484 Shady Creek Ct
- 48 Shadyleaf Ct
- 416 Tanglewood Ct
- 4705 Culebra Way
- 31 Springhill Ct
- 4926 Sunshine Ave
- 4930 Sunshine Ave
- 811 Swift Ct
- 4934 Sunshine Ave
- 809 Swift Ct
- 802 Swift Ct
- 4922 Sunshine Ave
- 801 Swift Ct
- 6689 Montecito Blvd
- 4938 Sunshine Ave
- 822 Pesado Calle
- 6695 Montecito Blvd
- 4942 Sunshine Ave
- 878 Pesado Calle
- 802 Pesado Calle
- 884 Gandul Calle
- 802 Pesado Calle Unkn
- 883 Gandul Calle
- 0 Montecito Blvd
- 4937 Sunshine Ave