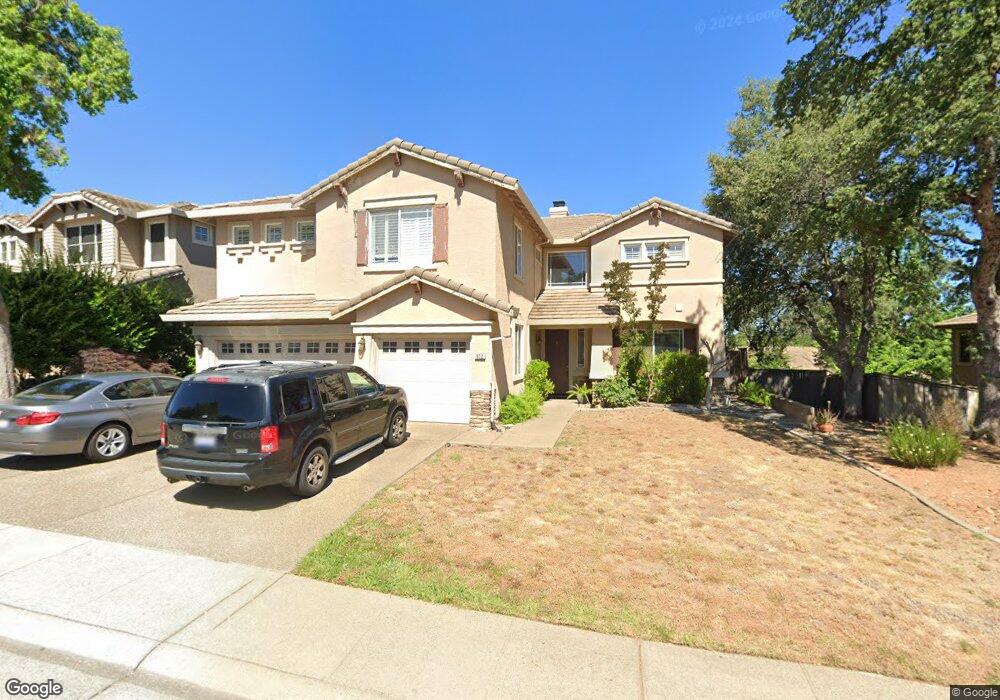
812 Travis St Folsom, CA 95630
Prairie Oaks NeighborhoodEstimated Value: $812,000 - $1,037,000
6
Beds
3
Baths
3,306
Sq Ft
$280/Sq Ft
Est. Value
About This Home
This home is located at 812 Travis St, Folsom, CA 95630 and is currently estimated at $926,846, approximately $280 per square foot. 812 Travis St is a home located in Sacramento County with nearby schools including Sandra J. Gallardo Elementary School, Sutter Middle School, and Folsom High School.
Ownership History
Date
Name
Owned For
Owner Type
Purchase Details
Closed on
Feb 22, 2001
Sold by
Lennar Renaissance Inc
Bought by
Vasanthan Mahesavelu M and Vasanthan Pathmavathy
Current Estimated Value
Home Financials for this Owner
Home Financials are based on the most recent Mortgage that was taken out on this home.
Original Mortgage
$262,700
Outstanding Balance
$94,181
Interest Rate
6.98%
Estimated Equity
$832,665
Create a Home Valuation Report for This Property
The Home Valuation Report is an in-depth analysis detailing your home's value as well as a comparison with similar homes in the area
Home Values in the Area
Average Home Value in this Area
Purchase History
| Date | Buyer | Sale Price | Title Company |
|---|---|---|---|
| Vasanthan Mahesavelu M | $341,000 | North American Title Guarant |
Source: Public Records
Mortgage History
| Date | Status | Borrower | Loan Amount |
|---|---|---|---|
| Open | Vasanthan Mahesavelu M | $262,700 |
Source: Public Records
Tax History
| Year | Tax Paid | Tax Assessment Tax Assessment Total Assessment is a certain percentage of the fair market value that is determined by local assessors to be the total taxable value of land and additions on the property. | Land | Improvement |
|---|---|---|---|---|
| 2025 | $6,248 | $539,943 | $135,602 | $404,341 |
| 2024 | $6,248 | $529,357 | $132,944 | $396,413 |
| 2023 | $6,136 | $518,979 | $130,338 | $388,641 |
| 2022 | $6,034 | $508,804 | $127,783 | $381,021 |
| 2021 | $5,959 | $498,828 | $125,278 | $373,550 |
| 2020 | $5,577 | $493,714 | $123,994 | $369,720 |
| 2019 | $5,487 | $484,034 | $121,563 | $362,471 |
| 2018 | $5,354 | $474,544 | $119,180 | $355,364 |
| 2017 | $6,854 | $465,241 | $116,844 | $348,397 |
| 2016 | $7,082 | $456,119 | $114,553 | $341,566 |
| 2015 | $6,841 | $449,269 | $112,833 | $336,436 |
| 2014 | $6,562 | $440,469 | $110,623 | $329,846 |
Source: Public Records
Map
Nearby Homes
- 631 Rogers Cir
- 968 Carter St
- 104 Hesser Ct
- 157 Sutcliffe Cir
- 632 Fisher Cir
- 0 Figueroa St Unit 225034113
- 683 Loomis Cir
- 102 Black Gold Ln
- 692 Humbert St
- 919 Sterling Cir
- 701 Ferrier Way
- 1054 Ledgestone Dr
- 2702 Ferry Cir Unit 102
- 145 Hopfield Dr
- 108 Austin Dr
- 894 Blossom Rock Ln
- 931 Willow Bridge Dr
- 682 Diamond Glen Cir
- 120 Elkins Cir
- 743 Moylegrove Ct
Your Personal Tour Guide
Ask me questions while you tour the home.