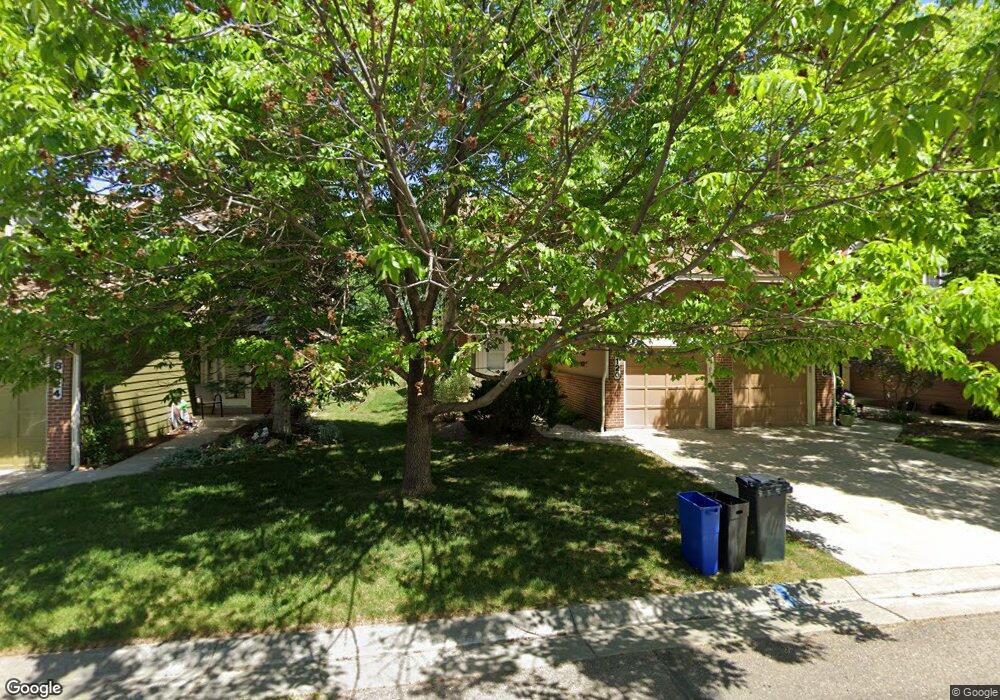
8120 Dry Creek Cir Niwot, CO 80503
Niwot NeighborhoodEstimated Value: $517,388 - $614,000
2
Beds
3
Baths
1,396
Sq Ft
$408/Sq Ft
Est. Value
About This Home
This home is located at 8120 Dry Creek Cir, Niwot, CO 80503 and is currently estimated at $569,097, approximately $407 per square foot. 8120 Dry Creek Cir is a home located in Boulder County with nearby schools including Niwot Elementary School, Sunset Middle School, and Niwot High School.
Ownership History
Date
Name
Owned For
Owner Type
Purchase Details
Closed on
Jun 30, 1995
Sold by
Moore Stephanie K
Bought by
Mitchell Mary
Current Estimated Value
Home Financials for this Owner
Home Financials are based on the most recent Mortgage that was taken out on this home.
Original Mortgage
$109,000
Interest Rate
7.79%
Purchase Details
Closed on
Jun 29, 1994
Sold by
Moore Jesse W
Bought by
Moore Stephanie K
Home Financials for this Owner
Home Financials are based on the most recent Mortgage that was taken out on this home.
Original Mortgage
$97,500
Interest Rate
7.25%
Purchase Details
Closed on
Jun 28, 1994
Sold by
Moore Brenda K
Bought by
Moore Stephanie K
Home Financials for this Owner
Home Financials are based on the most recent Mortgage that was taken out on this home.
Original Mortgage
$97,500
Interest Rate
7.25%
Purchase Details
Closed on
Feb 18, 1988
Bought by
Mitchell Mary
Purchase Details
Closed on
Jan 12, 1988
Bought by
Mitchell Mary
Create a Home Valuation Report for This Property
The Home Valuation Report is an in-depth analysis detailing your home's value as well as a comparison with similar homes in the area
Home Values in the Area
Average Home Value in this Area
Purchase History
| Date | Buyer | Sale Price | Title Company |
|---|---|---|---|
| Mitchell Mary | $165,000 | -- | |
| Moore Stephanie K | -- | First American Heritage Titl | |
| Moore Stephanie K | -- | First American Heritage Titl | |
| Mitchell Mary | $85,600 | -- | |
| Mitchell Mary | -- | -- |
Source: Public Records
Mortgage History
| Date | Status | Borrower | Loan Amount |
|---|---|---|---|
| Closed | Mitchell Mary | $109,000 | |
| Previous Owner | Moore Stephanie K | $97,500 |
Source: Public Records
Tax History Compared to Growth
Tax History
| Year | Tax Paid | Tax Assessment Tax Assessment Total Assessment is a certain percentage of the fair market value that is determined by local assessors to be the total taxable value of land and additions on the property. | Land | Improvement |
|---|---|---|---|---|
| 2025 | $3,306 | $34,550 | $6,625 | $27,925 |
| 2024 | $3,306 | $34,550 | $6,625 | $27,925 |
| 2023 | $3,263 | $33,239 | $6,131 | $30,793 |
| 2022 | $3,290 | $31,997 | $5,504 | $26,493 |
| 2021 | $3,334 | $32,919 | $5,663 | $27,256 |
| 2020 | $3,085 | $30,531 | $5,005 | $25,526 |
| 2019 | $3,035 | $30,531 | $5,005 | $25,526 |
| 2018 | $2,803 | $28,346 | $4,104 | $24,242 |
| 2017 | $2,638 | $31,338 | $4,537 | $26,801 |
| 2016 | $2,398 | $25,202 | $5,015 | $20,187 |
| 2015 | $2,284 | $21,285 | $4,935 | $16,350 |
| 2014 | $2,187 | $21,285 | $4,935 | $16,350 |
Source: Public Records
Map
Nearby Homes
- 8180 Dry Creek Cir
- 8076 Meadowdale Square
- 7284 Dry Creek Rd
- 8060 Niwot Rd Unit 66E
- 8060 Niwot Rd Unit 34
- 8050 Niwot Rd Unit 1
- 8050 Niwot Rd Unit 28
- 8050 Niwot Rd Unit 40
- 7369 Pebble Ct
- 8400 Sawtooth Ln
- 7187 Longview Dr
- 8748 Skyland Dr
- 8896 Niwot Rd
- 8020 N 81st St
- 6541 Legend Ridge Trail
- 3625 Nimbus Rd
- 6771 Niwot Hills Dr
- 9258 Niwot Hills Dr
- 6703 Asher Ct
- 9260 Shooting Star Ct
- 8124 Dry Creek Cir
- 8112 Dry Creek Cir
- 8128 Dry Creek Cir
- 8108 Dry Creek Cir
- 8104 Dry Creek Cir
- 8130 Dry Creek Cir
- 8100 Dry Creek Cir
- 8132 Dry Creek Cir
- 8119 Dry Creek Cir
- 8125 Dry Creek Cir
- 8125 Dry Creek Cir
- 8125 Dry Creek Cir Unit unknown
- 8142 Dry Creek Cir
- 8150 Dry Creek Cir
- 8154 Dry Creek Cir
- 8178 Dry Creek Cir
- 8184 Dry Creek Cir
- 8162 Dry Creek Cir
- 8174 Dry Creek Cir
- 8166 Dry Creek Cir