Estimated Value: $327,000 - $631,000
4
Beds
3
Baths
1,731
Sq Ft
$295/Sq Ft
Est. Value
About This Home
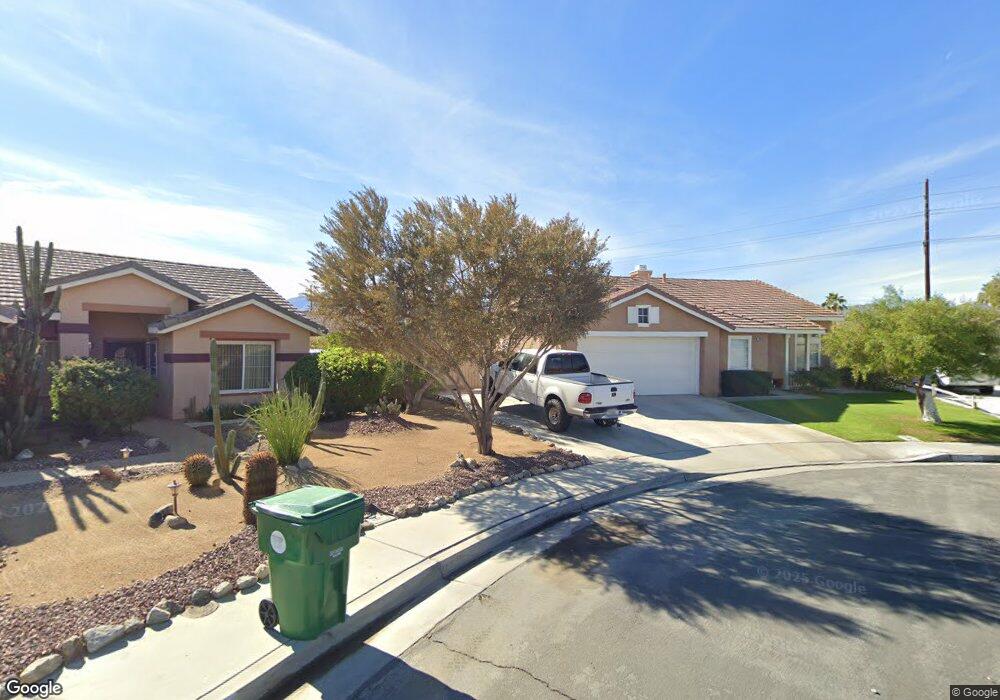
This home is located at 81225 Begonia Ct, Indio, CA 92201 and is currently estimated at $510,581, approximately $294 per square foot. 81225 Begonia Ct is a home located in Riverside County with nearby schools including Mountain Vista Elementary School, Cahuilla Desert Academy Junior High, and Coachella Valley High School.
Ownership History
Date
Name
Owned For
Owner Type
Purchase Details
Closed on
Mar 17, 2020
Sold by
Flores Eduardo and Flores Helen
Bought by
Flores Eduardo and Flores Helen
Current Estimated Value
Purchase Details
Closed on
Feb 19, 2020
Sold by
Chaffins Curtis L
Bought by
Chaffins Curtis and Chaffins Rebecca
Purchase Details
Closed on
Jan 2, 1996
Sold by
Chaffins Rebecca
Bought by
Chaffins Curtis L
Home Financials for this Owner
Home Financials are based on the most recent Mortgage that was taken out on this home.
Original Mortgage
$120,053
Outstanding Balance
$3,227
Interest Rate
7.25%
Mortgage Type
FHA
Estimated Equity
$507,354
Purchase Details
Closed on
Oct 11, 1994
Sold by
Kaufman & Broad Of Southern Ca Inc
Bought by
Chaffins Curtis L
Home Financials for this Owner
Home Financials are based on the most recent Mortgage that was taken out on this home.
Original Mortgage
$120,655
Interest Rate
8.92%
Mortgage Type
FHA
Create a Home Valuation Report for This Property
The Home Valuation Report is an in-depth analysis detailing your home's value as well as a comparison with similar homes in the area
Home Values in the Area
Average Home Value in this Area
Purchase History
We collect this data history from publicly available records. To have your information removed, we recommend requesting removal directly through your county’s website.
| Date | Buyer | Sale Price | Title Company |
|---|---|---|---|
| Flores Eduardo | -- | None Available | |
| Chaffins Curtis | -- | None Available | |
| Chaffins Curtis L | -- | Landsafe Title | |
| Chaffins Curtis L | $122,000 | First American Title Ins Co |
Source: Public Records
Mortgage History
We collect this data history from publicly available records. To have your information removed, we recommend requesting removal directly through your county’s website.
| Date | Status | Borrower | Loan Amount |
|---|---|---|---|
| Open | Chaffins Curtis L | $120,053 | |
| Previous Owner | Chaffins Curtis L | $120,655 |
Source: Public Records
Tax History
| Year | Tax Paid | Tax Assessment Tax Assessment Total Assessment is a certain percentage of the fair market value that is determined by local assessors to be the total taxable value of land and additions on the property. | Land | Improvement |
|---|---|---|---|---|
| 2025 | $3,730 | $204,878 | $33,572 | $171,306 |
| 2023 | $3,730 | $196,924 | $32,269 | $164,655 |
| 2022 | $3,513 | $193,064 | $31,637 | $161,427 |
| 2021 | $3,342 | $189,279 | $31,017 | $158,262 |
| 2020 | $3,097 | $187,339 | $30,699 | $156,640 |
| 2019 | $3,027 | $183,667 | $30,098 | $153,569 |
| 2018 | $2,958 | $180,066 | $29,508 | $150,558 |
| 2017 | $2,957 | $176,536 | $28,930 | $147,606 |
| 2016 | $2,872 | $173,075 | $28,363 | $144,712 |
| 2015 | $2,709 | $170,478 | $27,938 | $142,540 |
| 2014 | $2,664 | $167,141 | $27,392 | $139,749 |
Source: Public Records
Map
Nearby Homes
- 81220 Iris Ct
- 49233 Constitution Dr
- 48820 Renewal St
- 81084 Falling Leaf Ct
- 80864 Rockhurst Dr
- 48647 Renewal St
- 80927 Serenity Dr
- 49481 Rock Rose Dr
- 81620 Avenue 49 Unit 40a
- 81620 Avenue 49 Unit 66a
- 81620 Avenue 49 Unit 118a
- 81620 Avenue 49 Unit 160b
- 81620 Avenue 49 Unit 1A
- 81620 Avenue 49 Unit 276b
- 81620 Avenue 49 Unit 8a
- 81620 Avenue 49 Unit 231b
- 81620 Avenue 49 Unit 97a
- 81620 Avenue 49 Unit 261B
- 81620 Avenue 49 Unit 90A
- 81620 Avenue 49 Unit 243
- 81231 Begonia Ct
- 81220 Begonia Ct
- 81224 Iris Ct
- 81230 Iris Ct
- 81245 Begonia Ct
- 81224 Begonia Ct
- 81244 Iris Ct
- 81230 Begonia Ct
- 81257 Begonia Ct
- 81244 Begonia Ct
- 81256 Iris Ct
- 81256 Begonia Ct
- 81225 Iris Ct
- 81269 Begonia Ct
- 81225 Daffodil Ct
- 81231 Daffodil Ct
- 81231 Iris Ct
- 81268 Iris Ct
- 81245 Iris Ct
- 81245 Daffodil Ct
Your Personal Tour Guide
Ask me questions while you tour the home.